Usage monitoring
Usage monitoring Overview
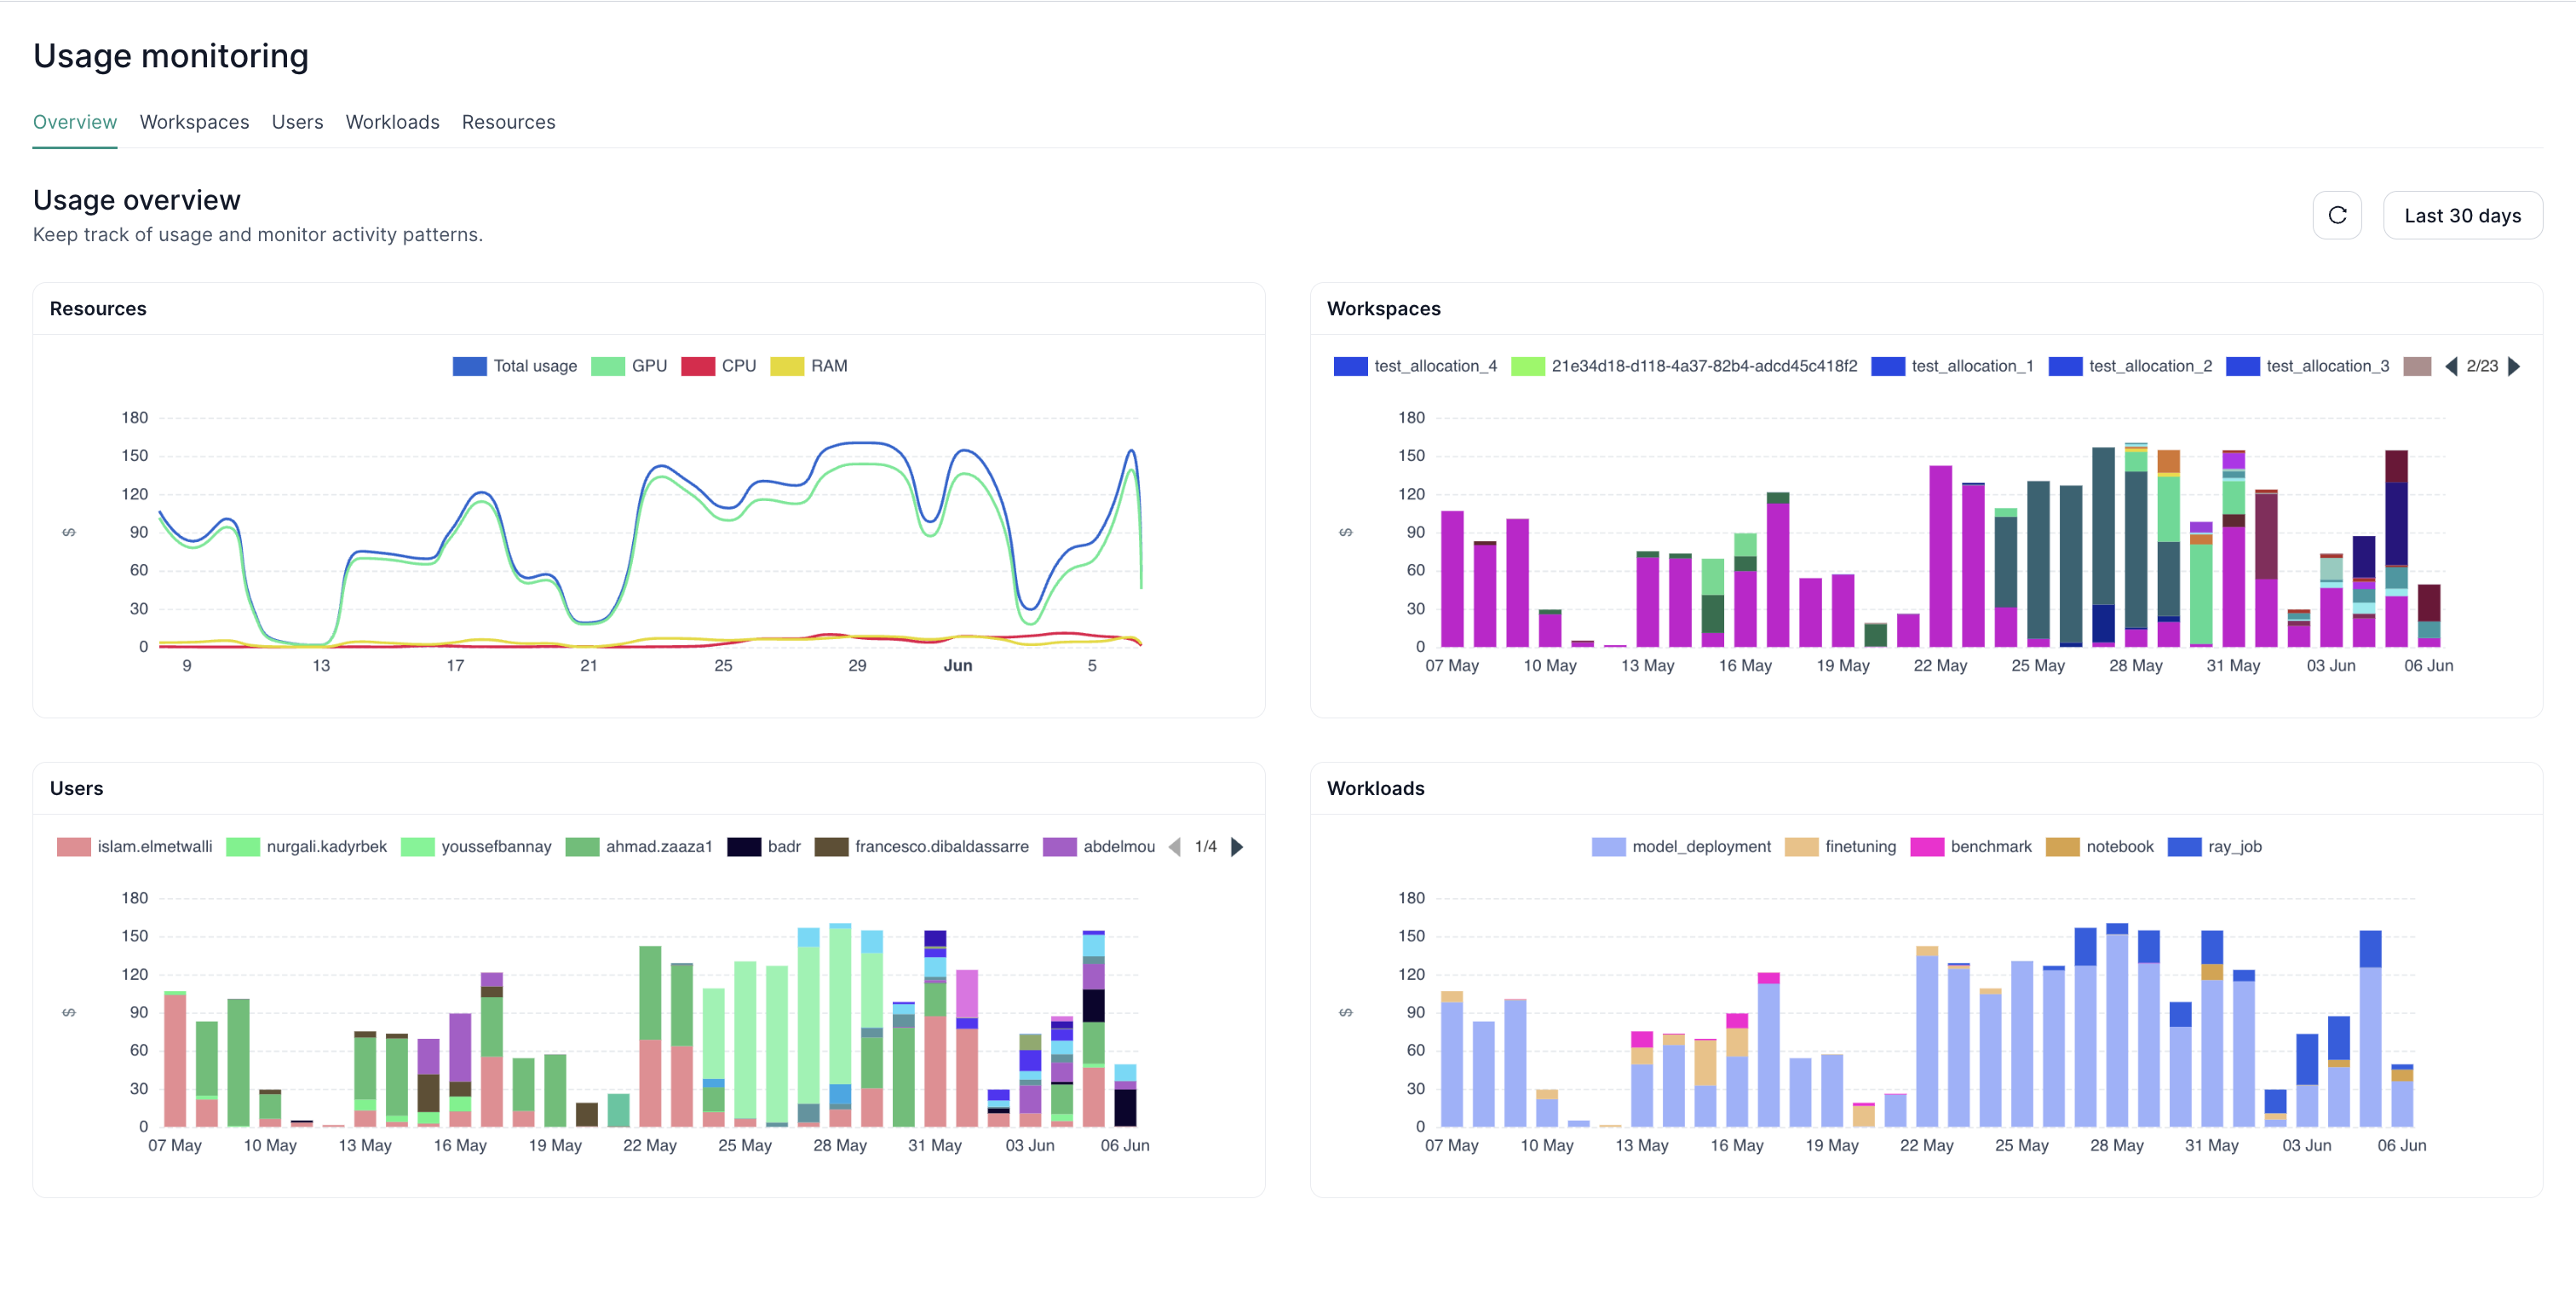
This default page allows admin to have anmonitor the usage interactively. Fields, entity names and timeframe of interest can be edited in the UI. Customizable dashboards can help the team analyze the usage trends in depth.
This overview page displays usage statistics segmented by workspace, by user, by workload, and by resource, enabling admins to effectively understand and manage the distribution and utilization of platform resources across their tenant.
Usage monitoring by Workspaces
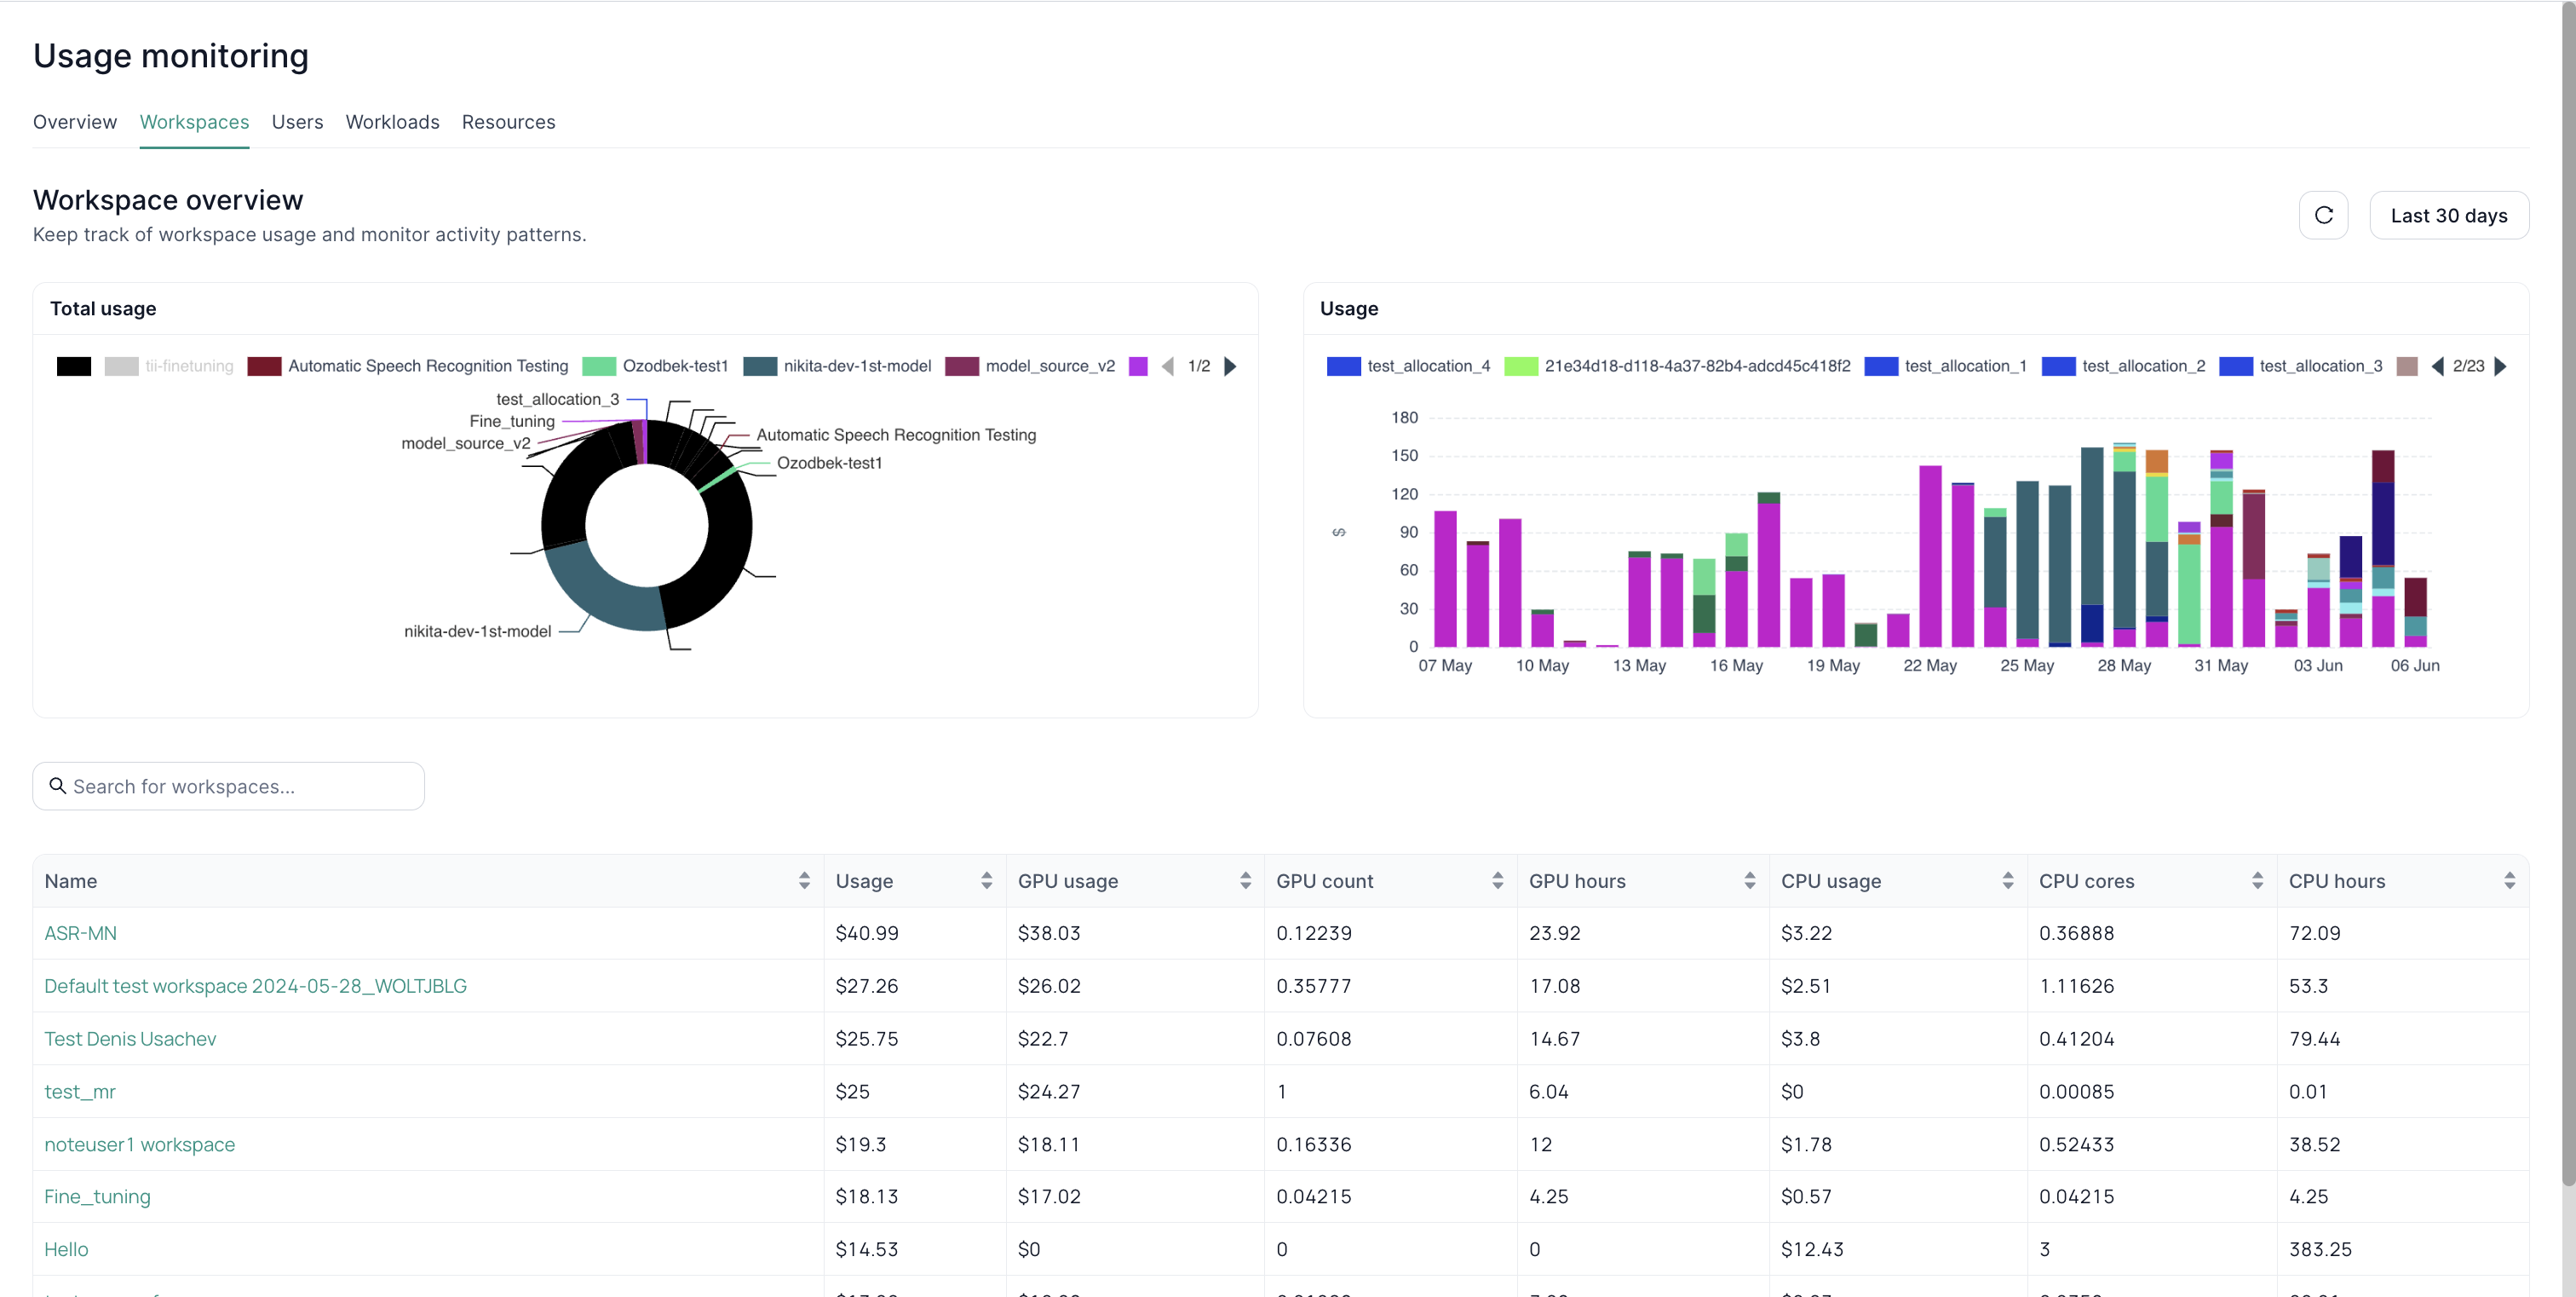
This view provides a comprehensive overview of resource utilization across all workspaces on the platform. It allows you to quickly identify which workspaces are consuming the most resources and to track usage trends over time. The pie chart visualizes the proportion of resources used by each workspace, while the bar graph shows detailed usage patterns over a selected period.
Usage monitoring by Users
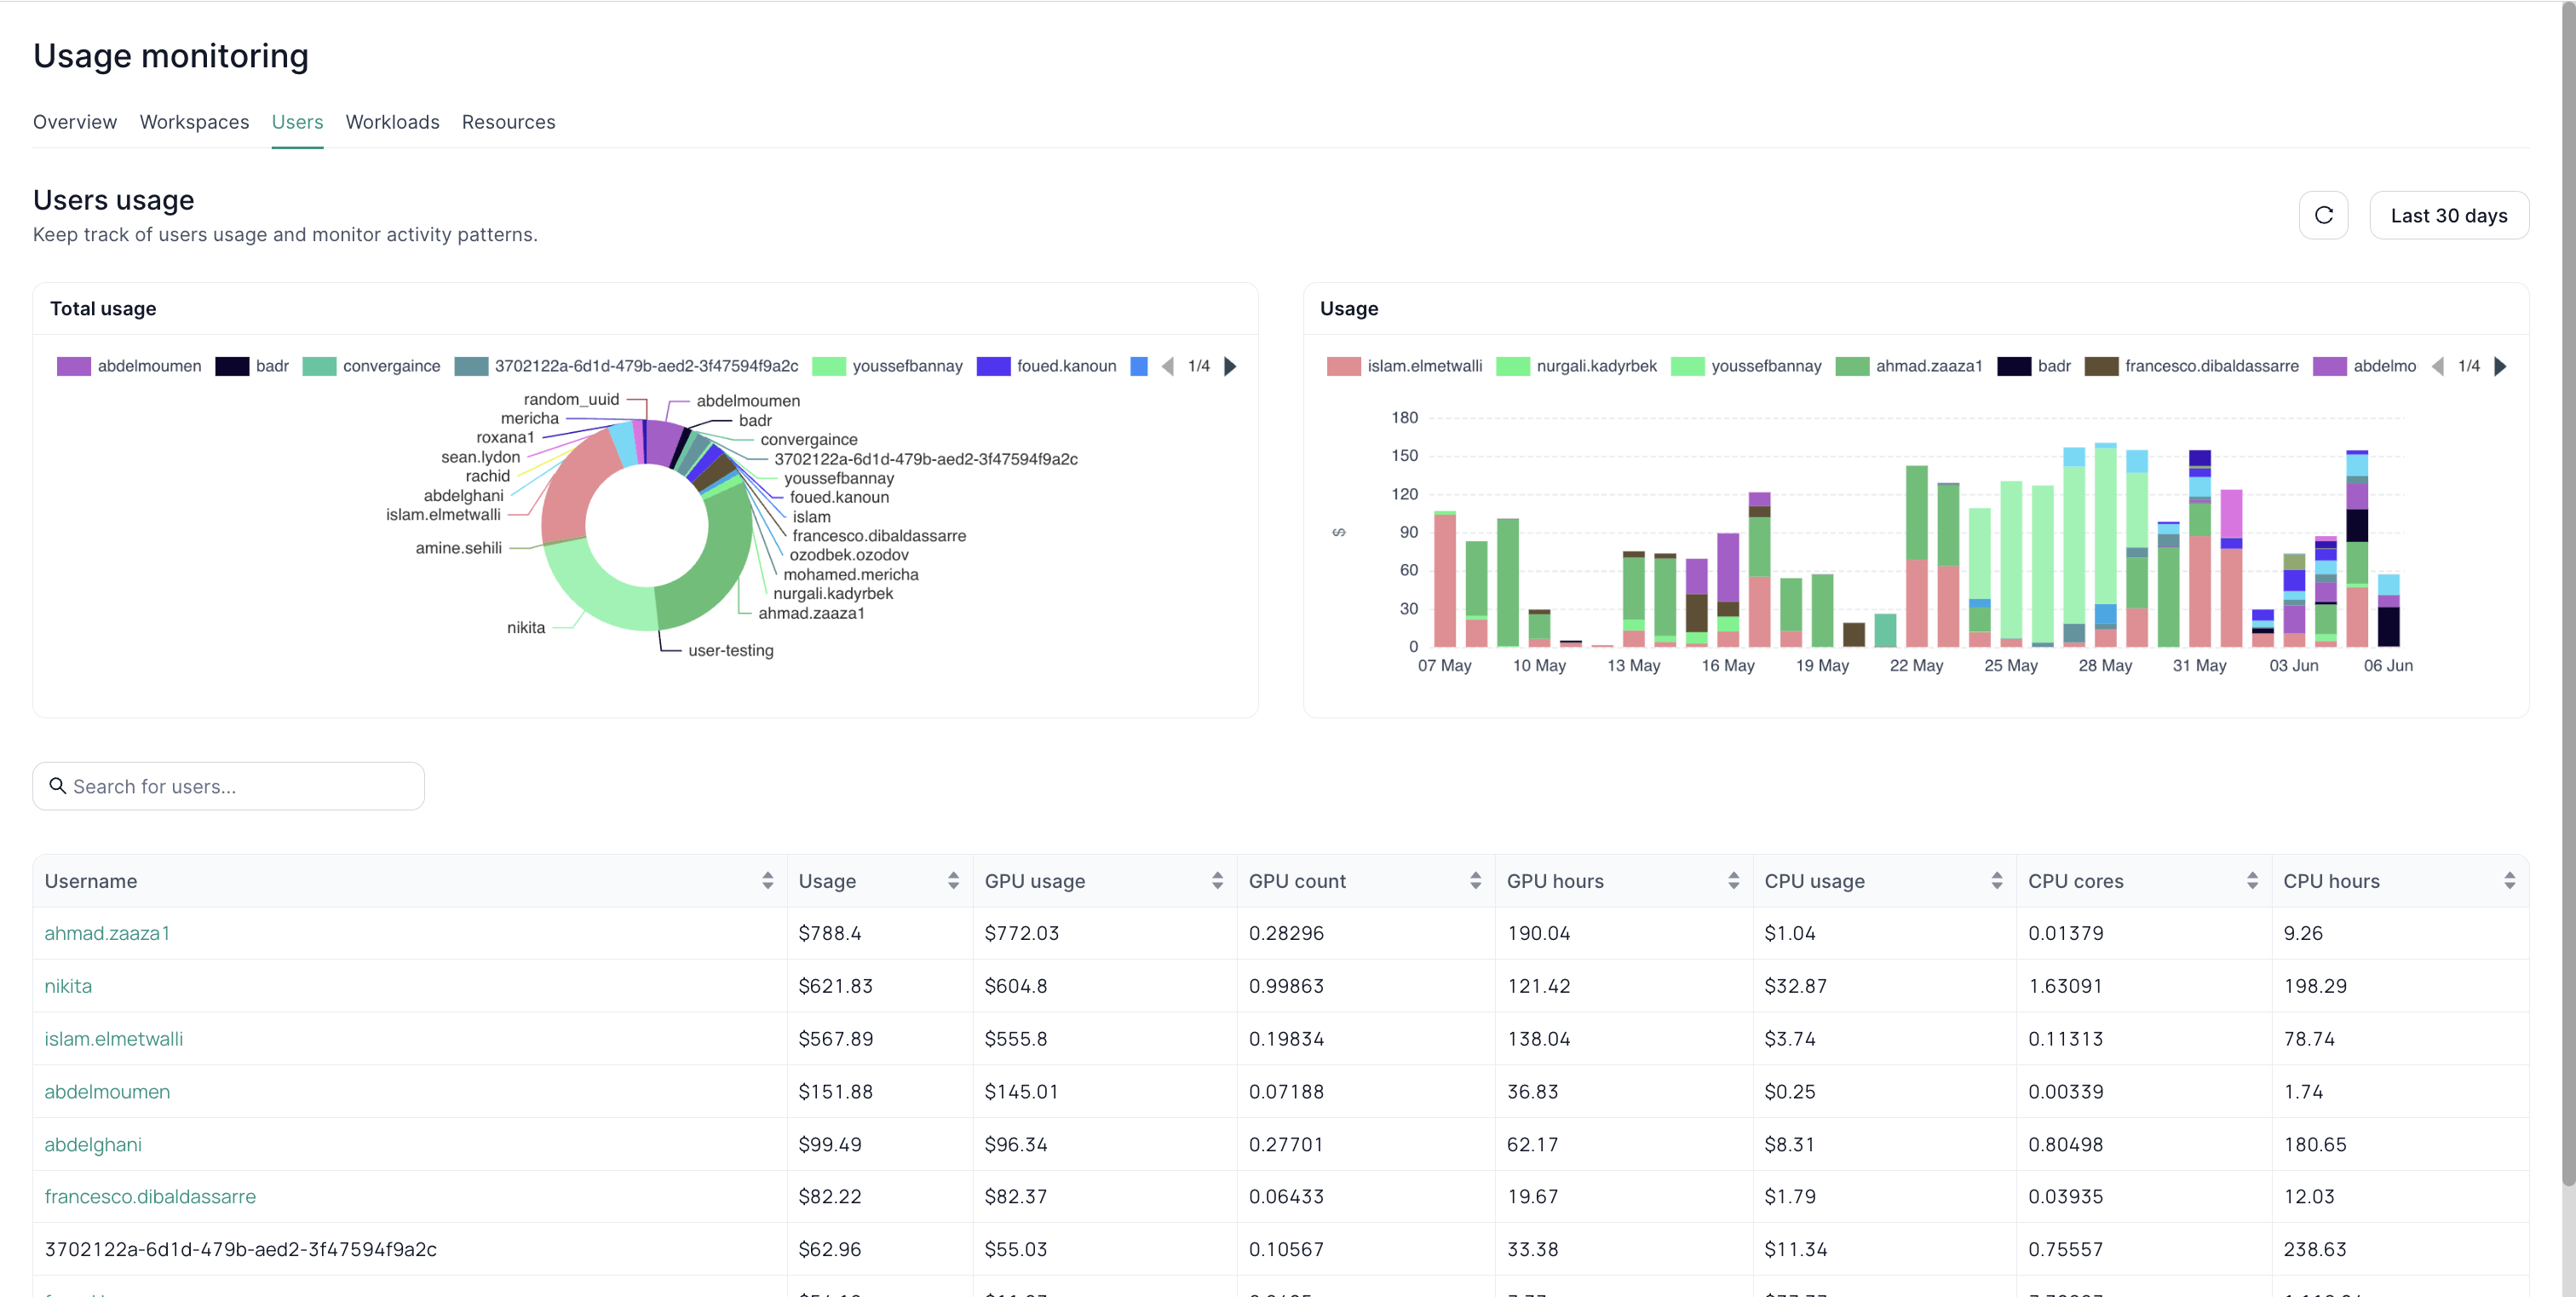
This view shifts the focus to individual user accounts, highlighting which users are the most active in terms of resource consumption. The pie chart shows the distribution of resource usage among users, while the bar graph displays their usage patterns over time. This can be valuable for identifying power users or potential areas for optimization.
Usage monitoring by Workloads
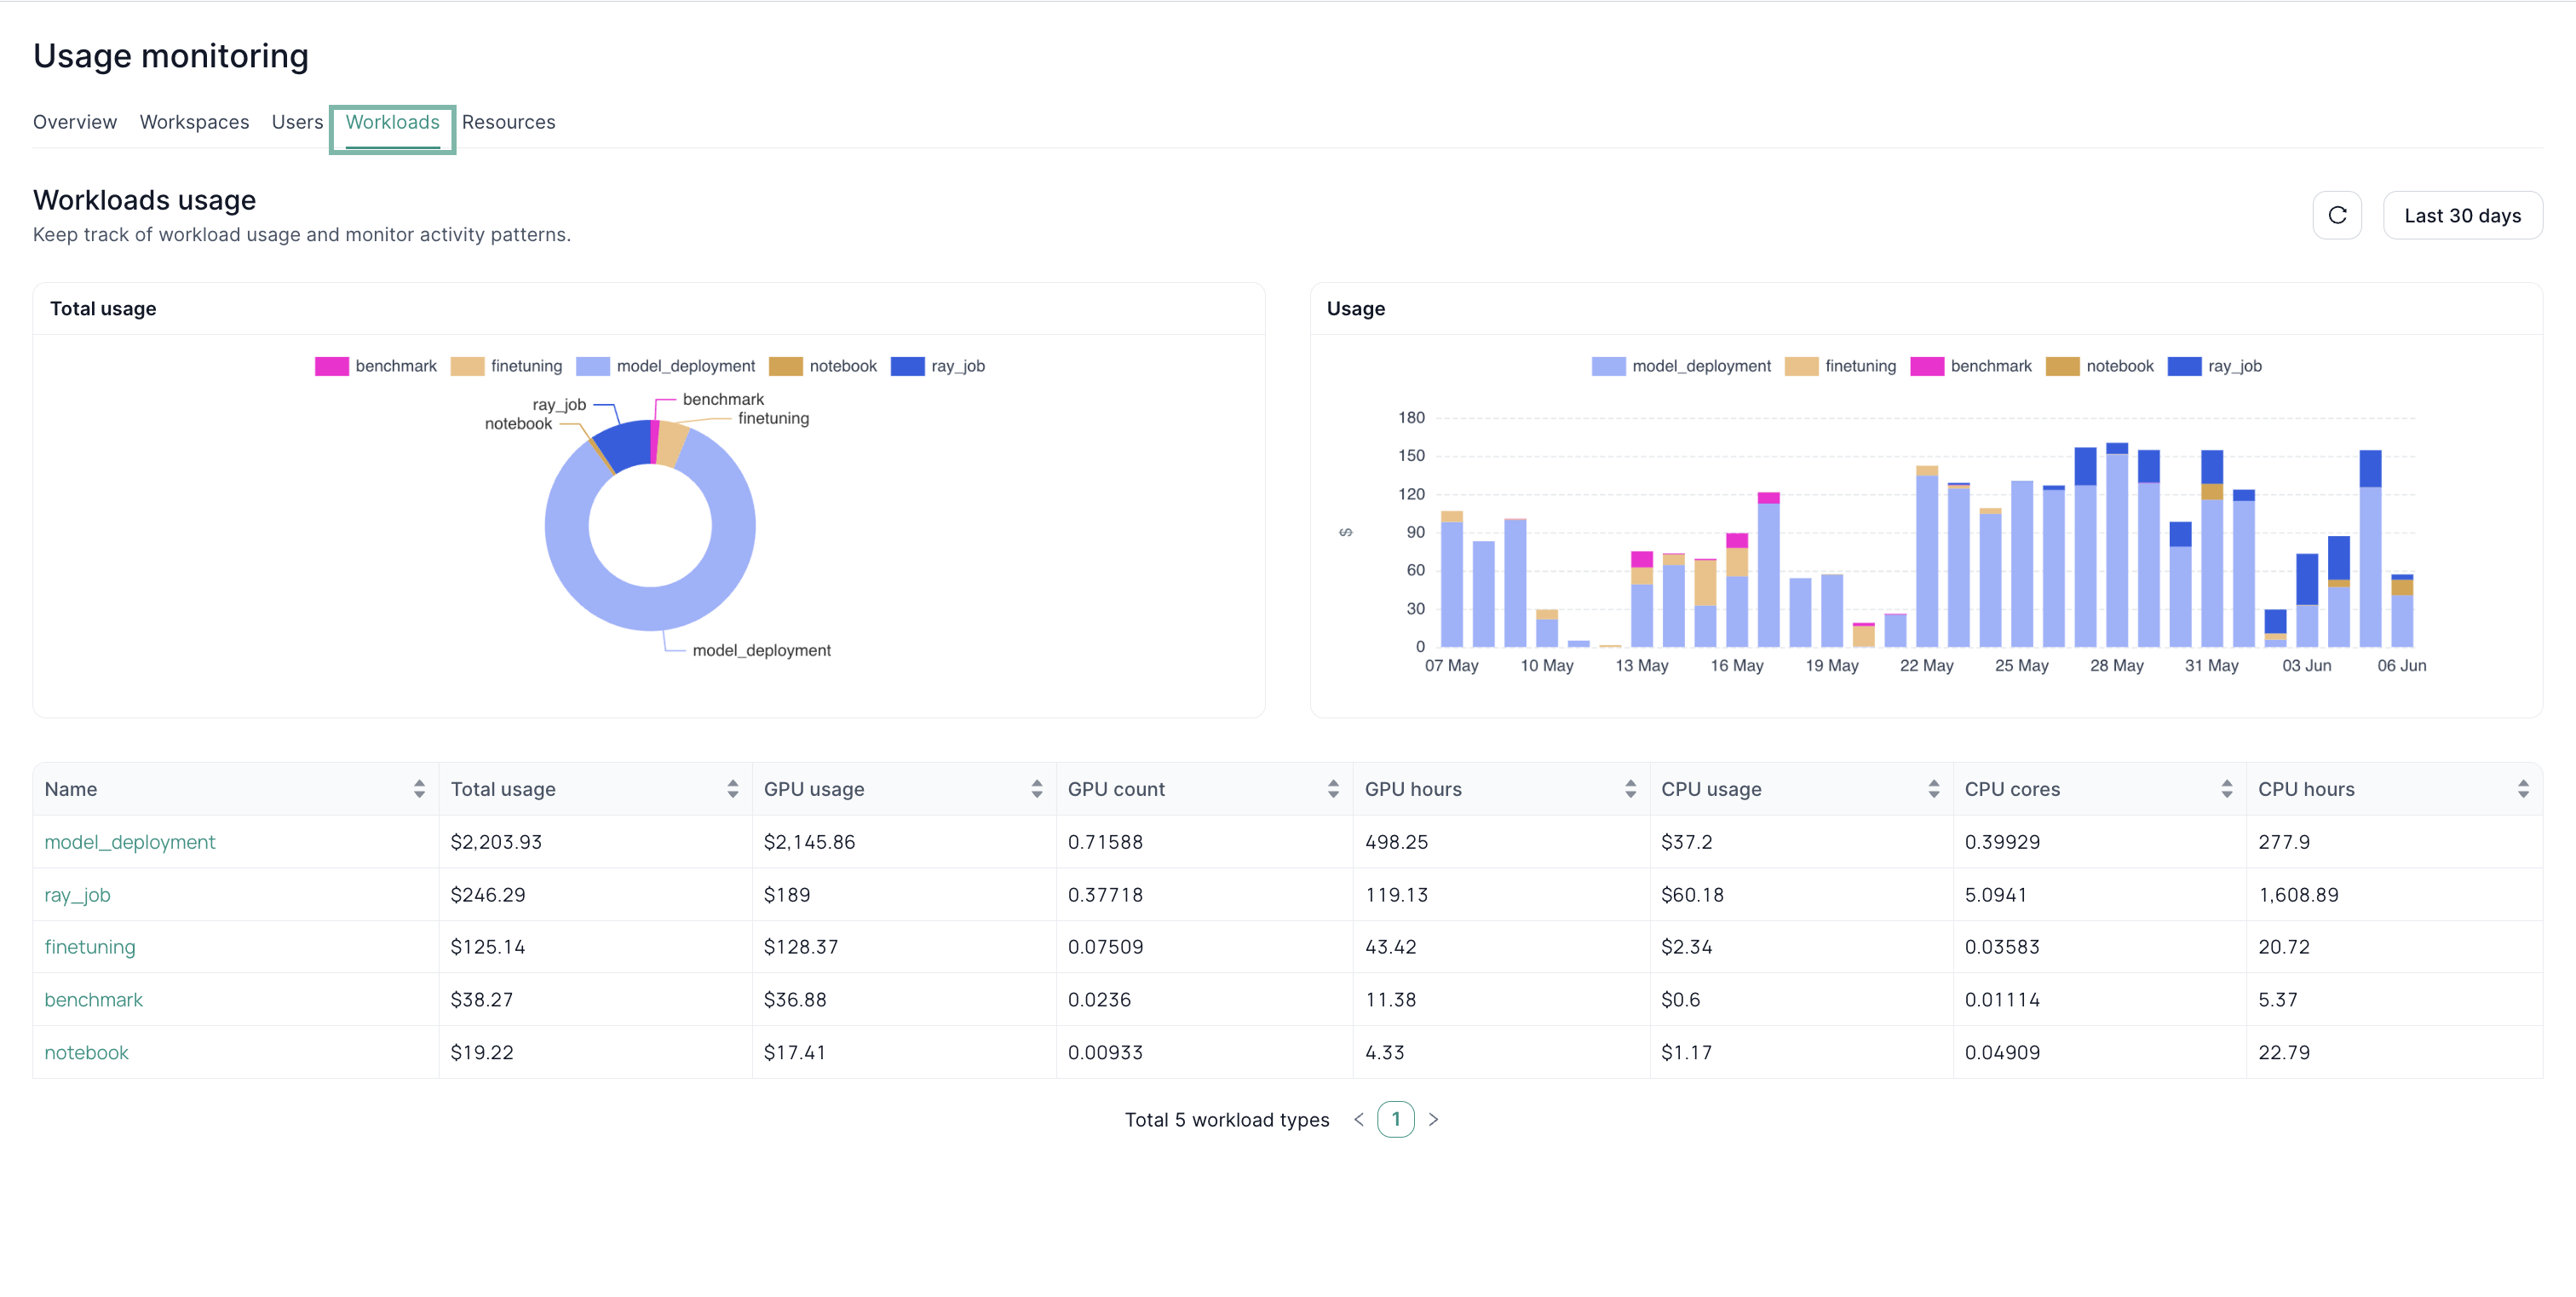
This view displays the distribution of resource usage across different workload types (e.g., fine-tuning, deployment). The pie chart shows the proportion of resources used by each workload type, and the bar graph reveals how usage for each workload has changed over time. The table provides a detailed breakdown of usage per workload.
Usage monitoring by Resources
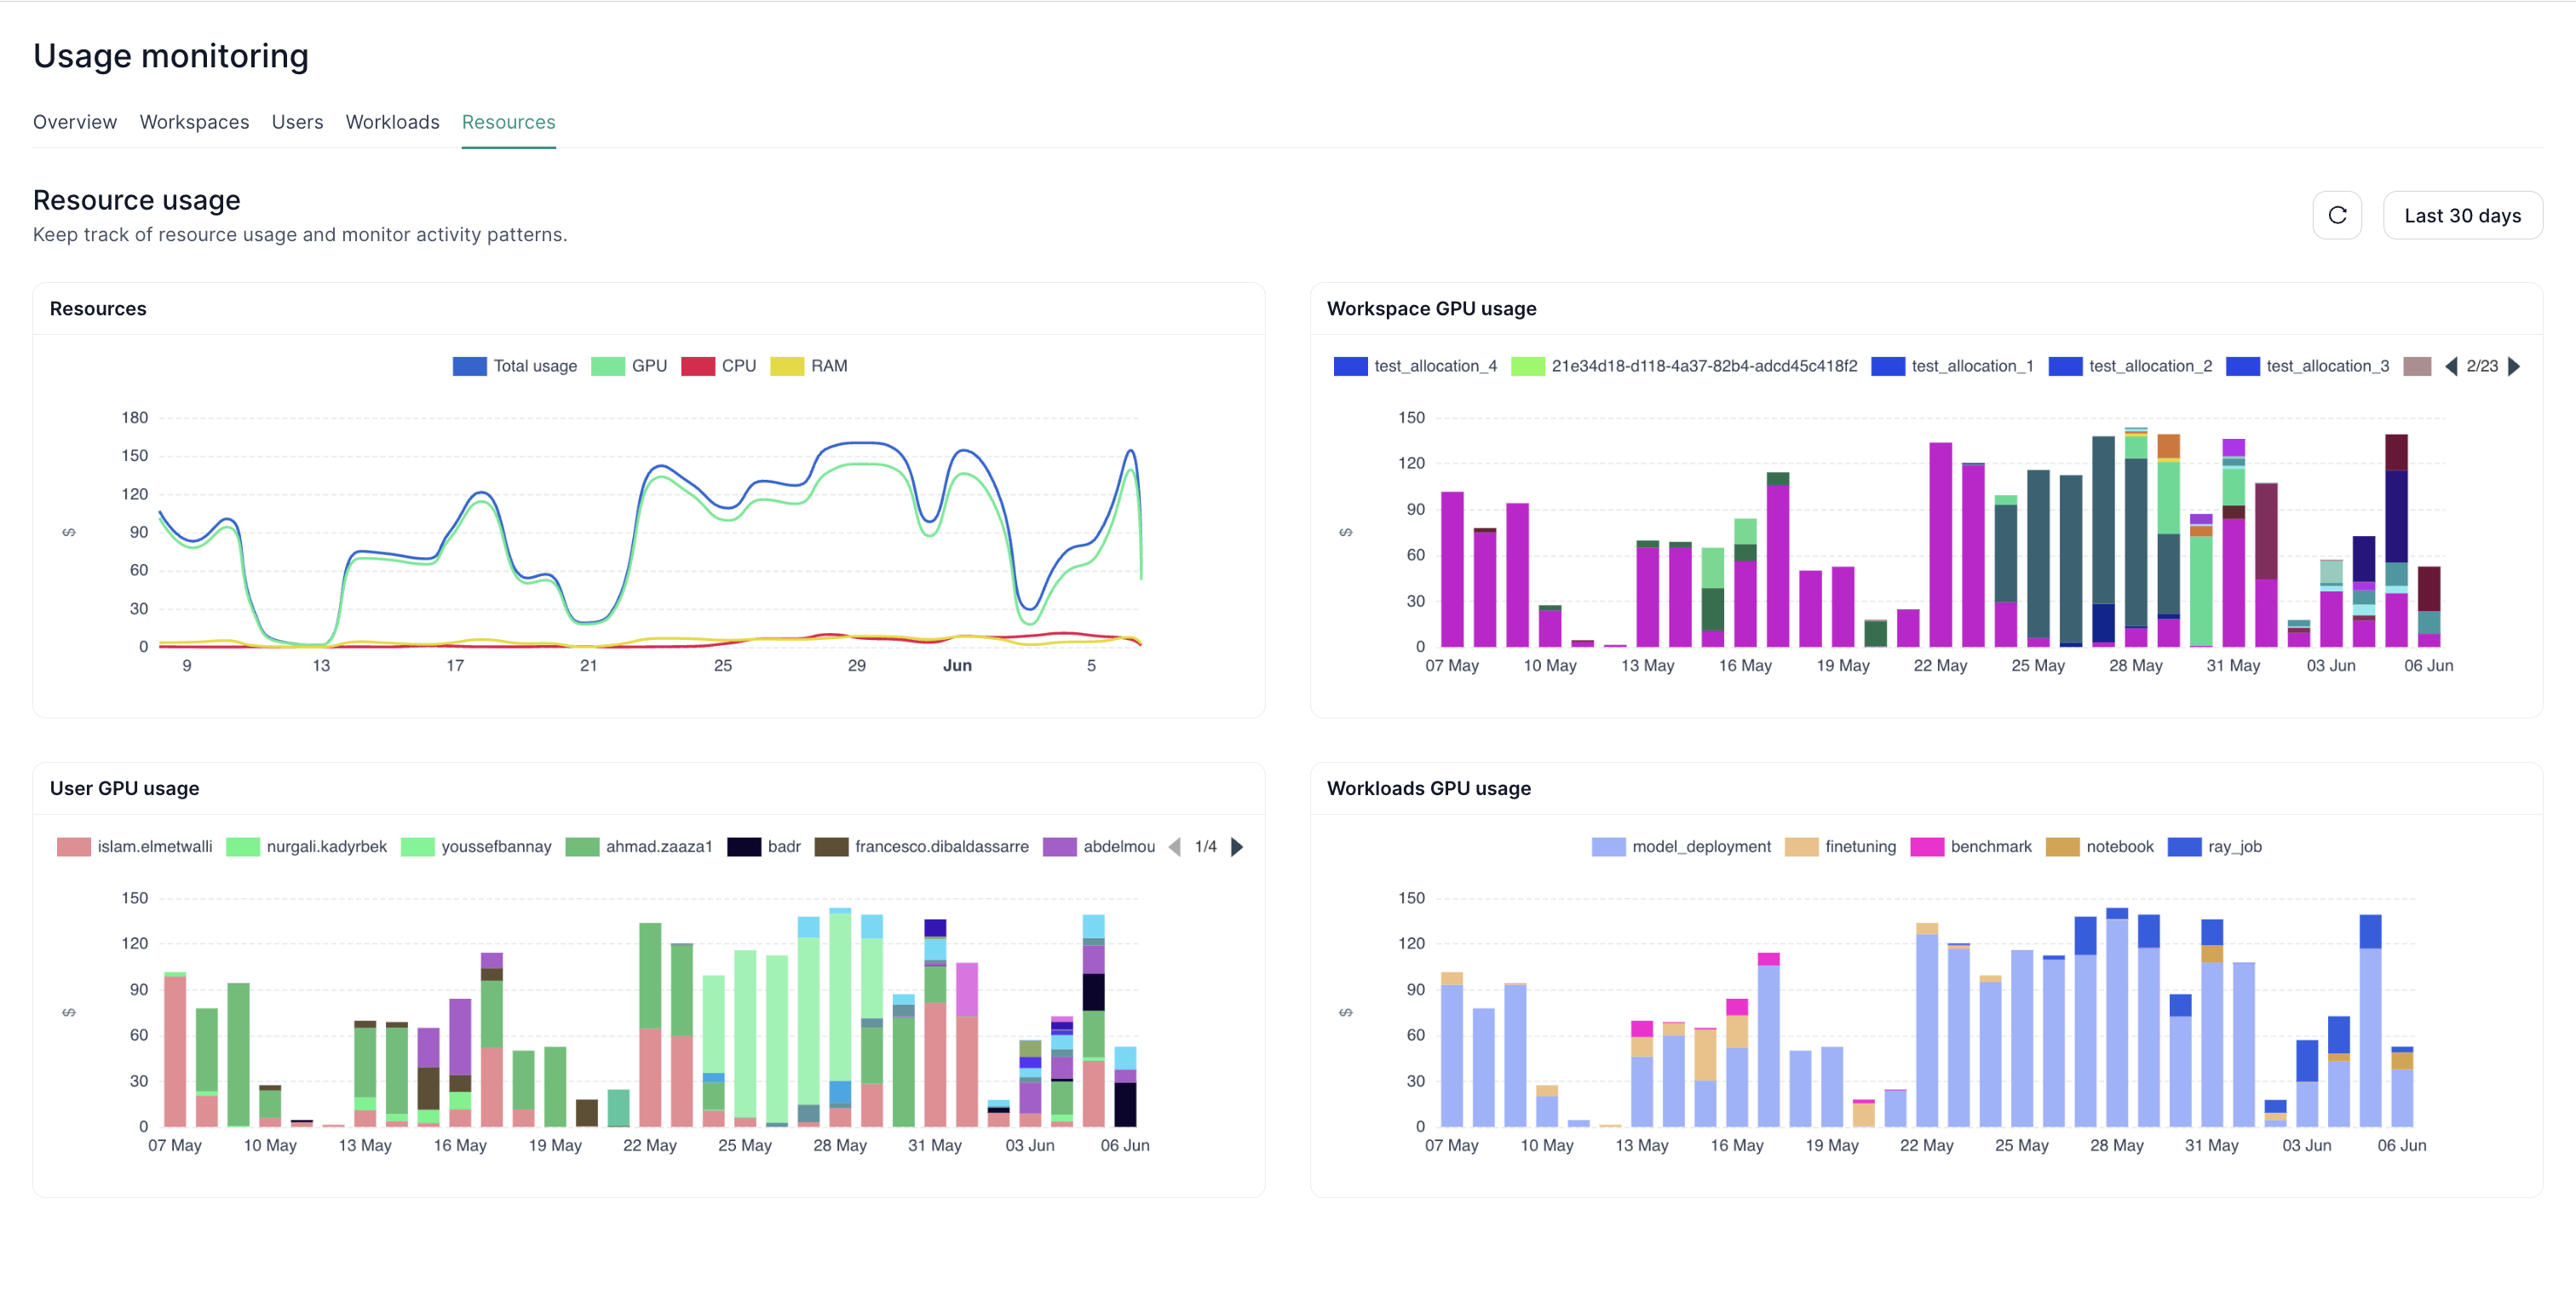
This view breaks down usage by specific resource types (GPU, CPU, RAM).