Runs
Getting Started with Run
A run is a single tracked execution inside an experiment. For example, one run can represent training an SGDRegressor, and another run can represent training an MLPRegressor on the same dataset.
Runs are where TrackingClient records the actual work done by a script:
- Params: key/value metadata that describe the run configuration, such as model name, dataset, learning rate, or number of epochs.
- Metrics: numeric values logged during the run, such as
rmse,loss,accuracy, orauc. - Tags: labels that help categorize the run.
- System metrics: resource metrics collected automatically while the run is active.
Example:
from oip_tracking_client.v2.tracking import TrackingClient
# 1. Configure client
tc = TrackingClient(
api_host="https://YOUR-OICM-HOST/api/tracking",
api_key="YOUR_API_KEY",
)
# 2. Choose experiment context
tc.set_experiment(
workspace_id="YOUR_WORKSPACE_ID",
experiment_name="customer-churn-training",
)
# 3. Start a run
with tc.start_run(run_name="xgboost-baseline"):
# 4. Log configuration for this run
tc.log_params({
"model": "xgboost",
"dataset": "customer_churn_v3",
"learning_rate": 0.05,
"batch_size": 128,
"epochs": 10,
})
# 5. Training loop
for step in range(1, 11):
# Pseudo training work
train_loss = ...
val_accuracy = ...
# 6. Log step-wise metrics
tc.log_metric("train_loss", train_loss, step=step)
tc.log_metric("val_accuracy", val_accuracy, step=step)
This is a short snippet to show the TrackingClient flow. For a runnable script that creates the run shown in the screenshots below, see Getting Started.
Run Overview
Open a run from the experiment's Runs tab to view its details.

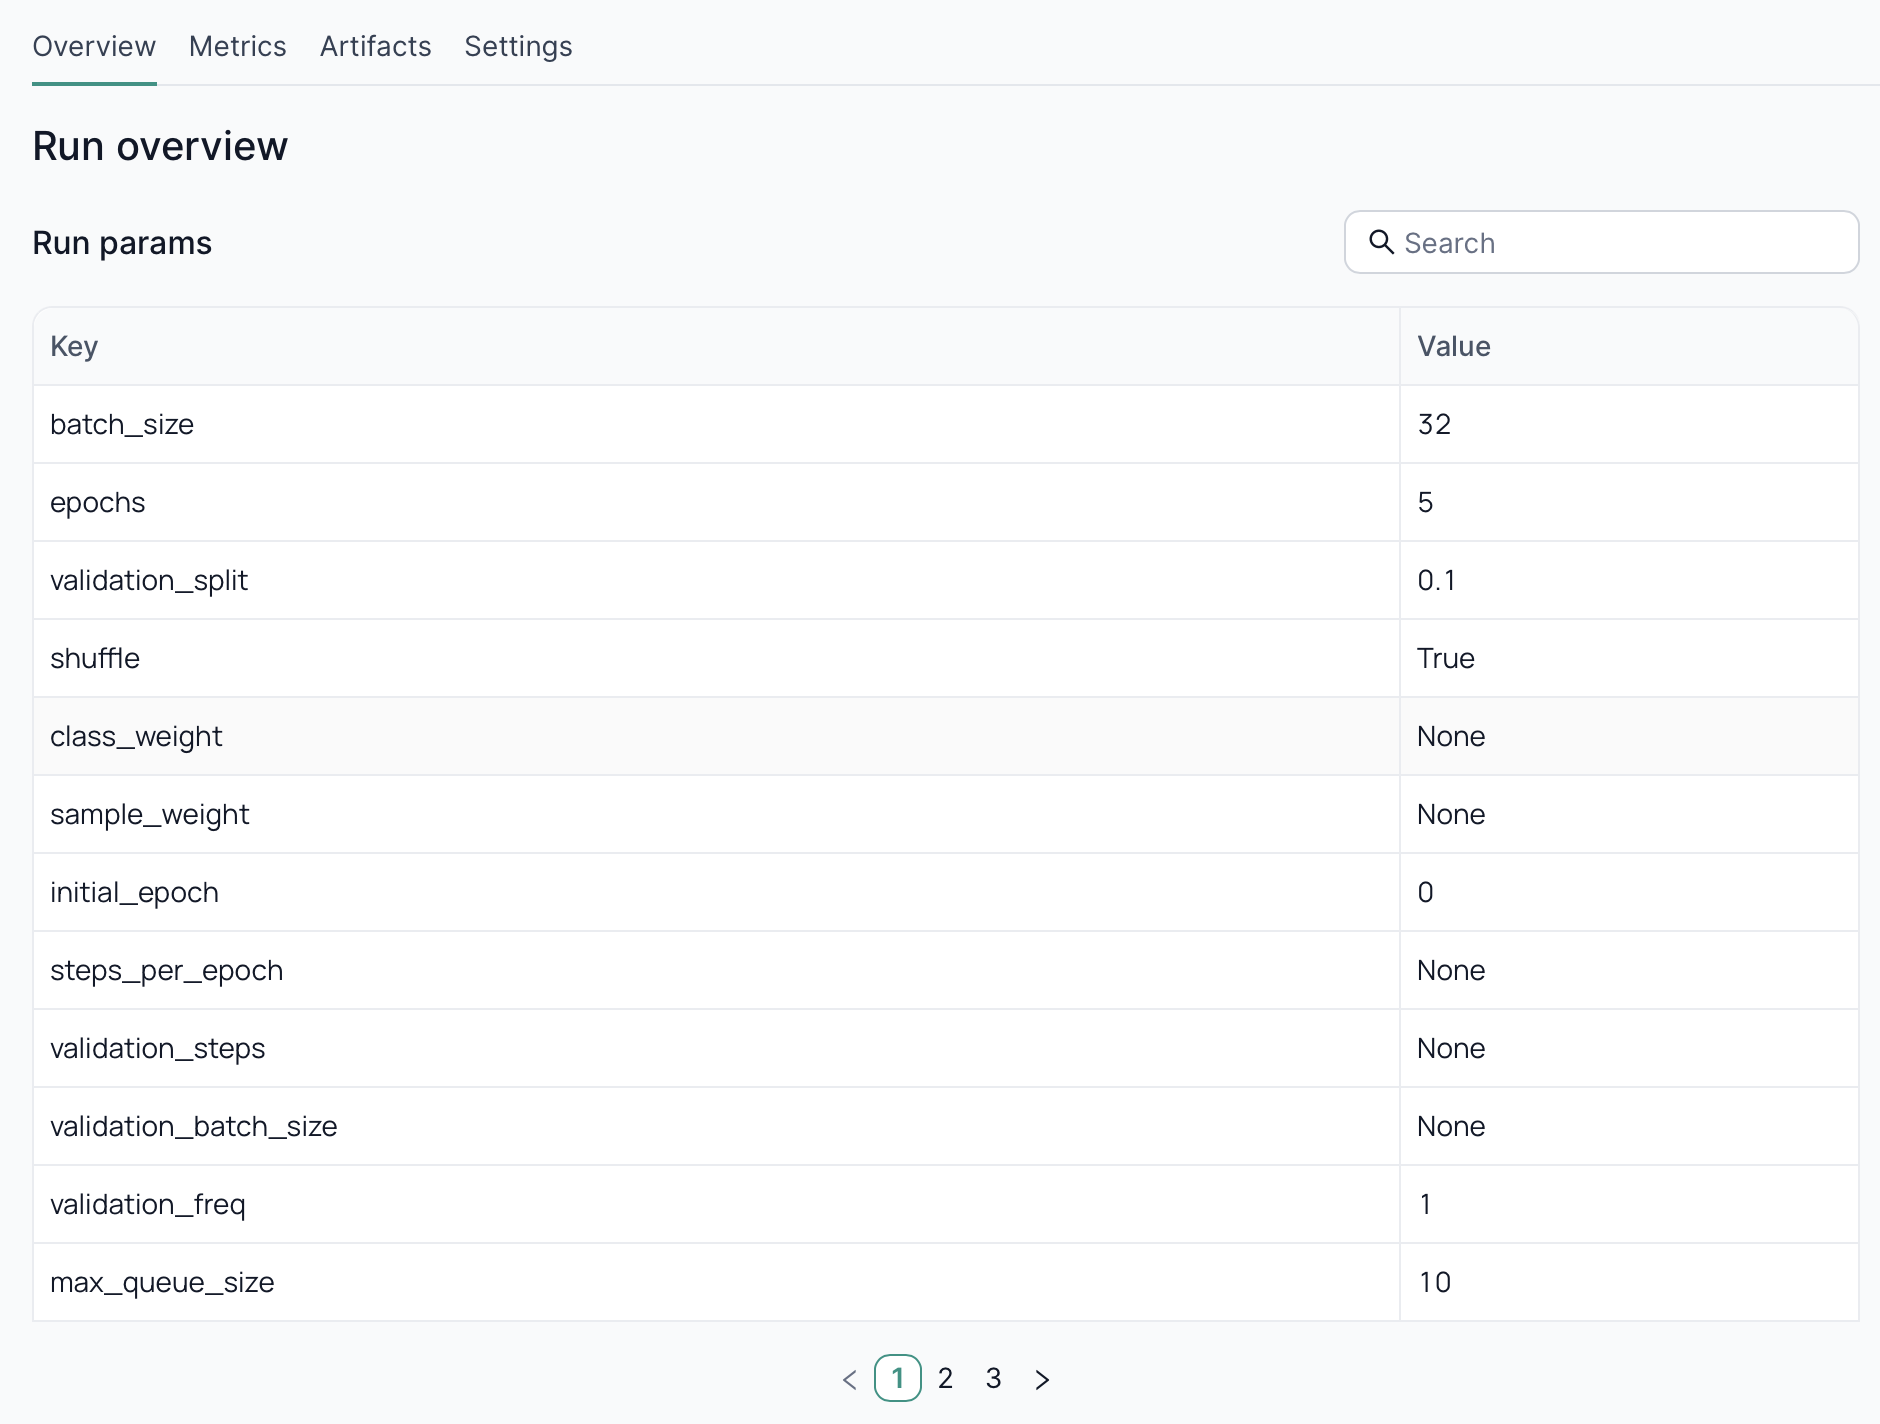
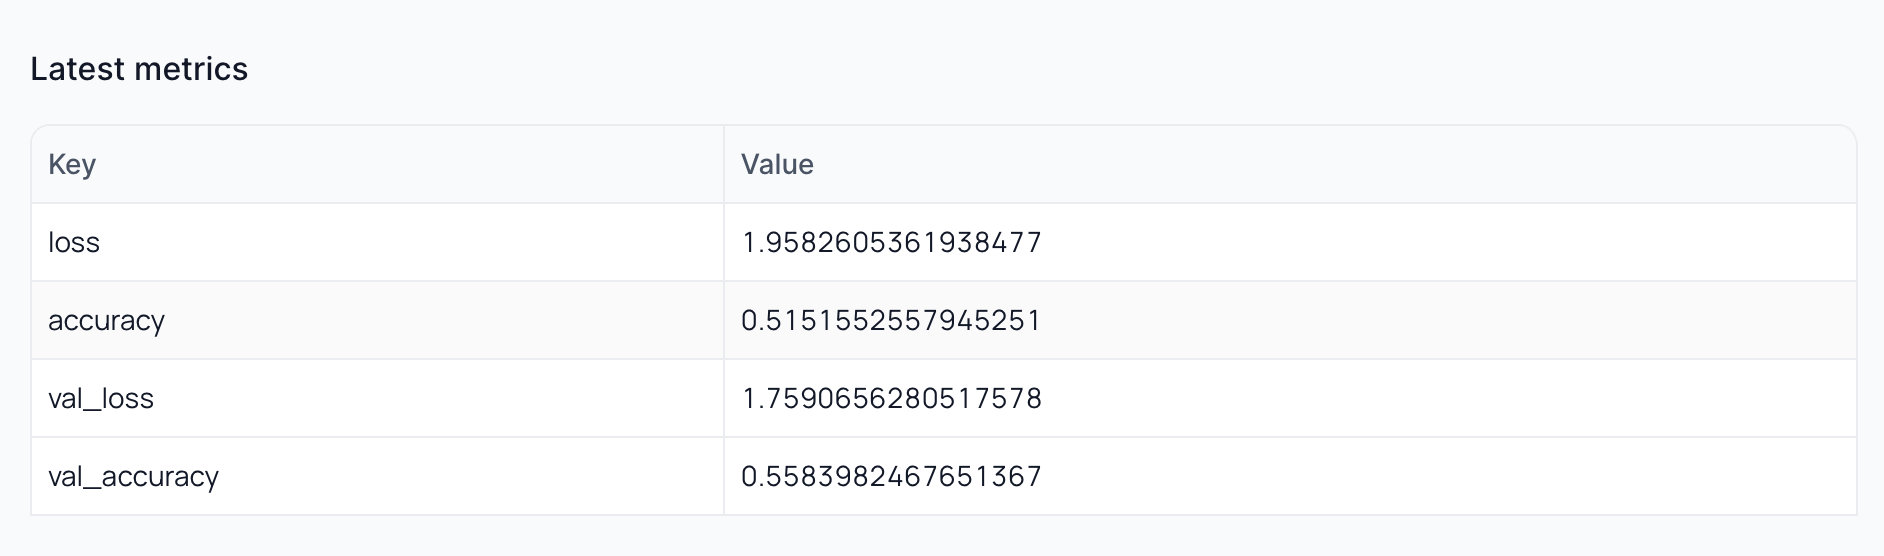
The Overview tab shows:
- Run params: the parameters logged with
tc.log_param(...)ortc.log_params(...). - Latest metrics: the latest value recorded for each metric key.
- Run information: status, run ID, created time, last updated time, and run duration.
In the screenshot above, the run params show the training configuration for sgd-training-demo. The latest metrics table includes both the user-logged metric keys and system metric keys.
System metrics are logged by default when a run starts. The default system metrics visible in the UI include:
system/cpu_utilization_percentagesystem/system_memory_usage_megabytessystem/system_memory_usage_percentagesystem/disk_usage_percentagesystem/disk_usage_megabytessystem/disk_available_megabytessystem/network_receive_megabytessystem/network_transmit_megabytes
When AMD GPU monitoring is available, additional amd_gpu_* metrics can also be logged.
Metrics
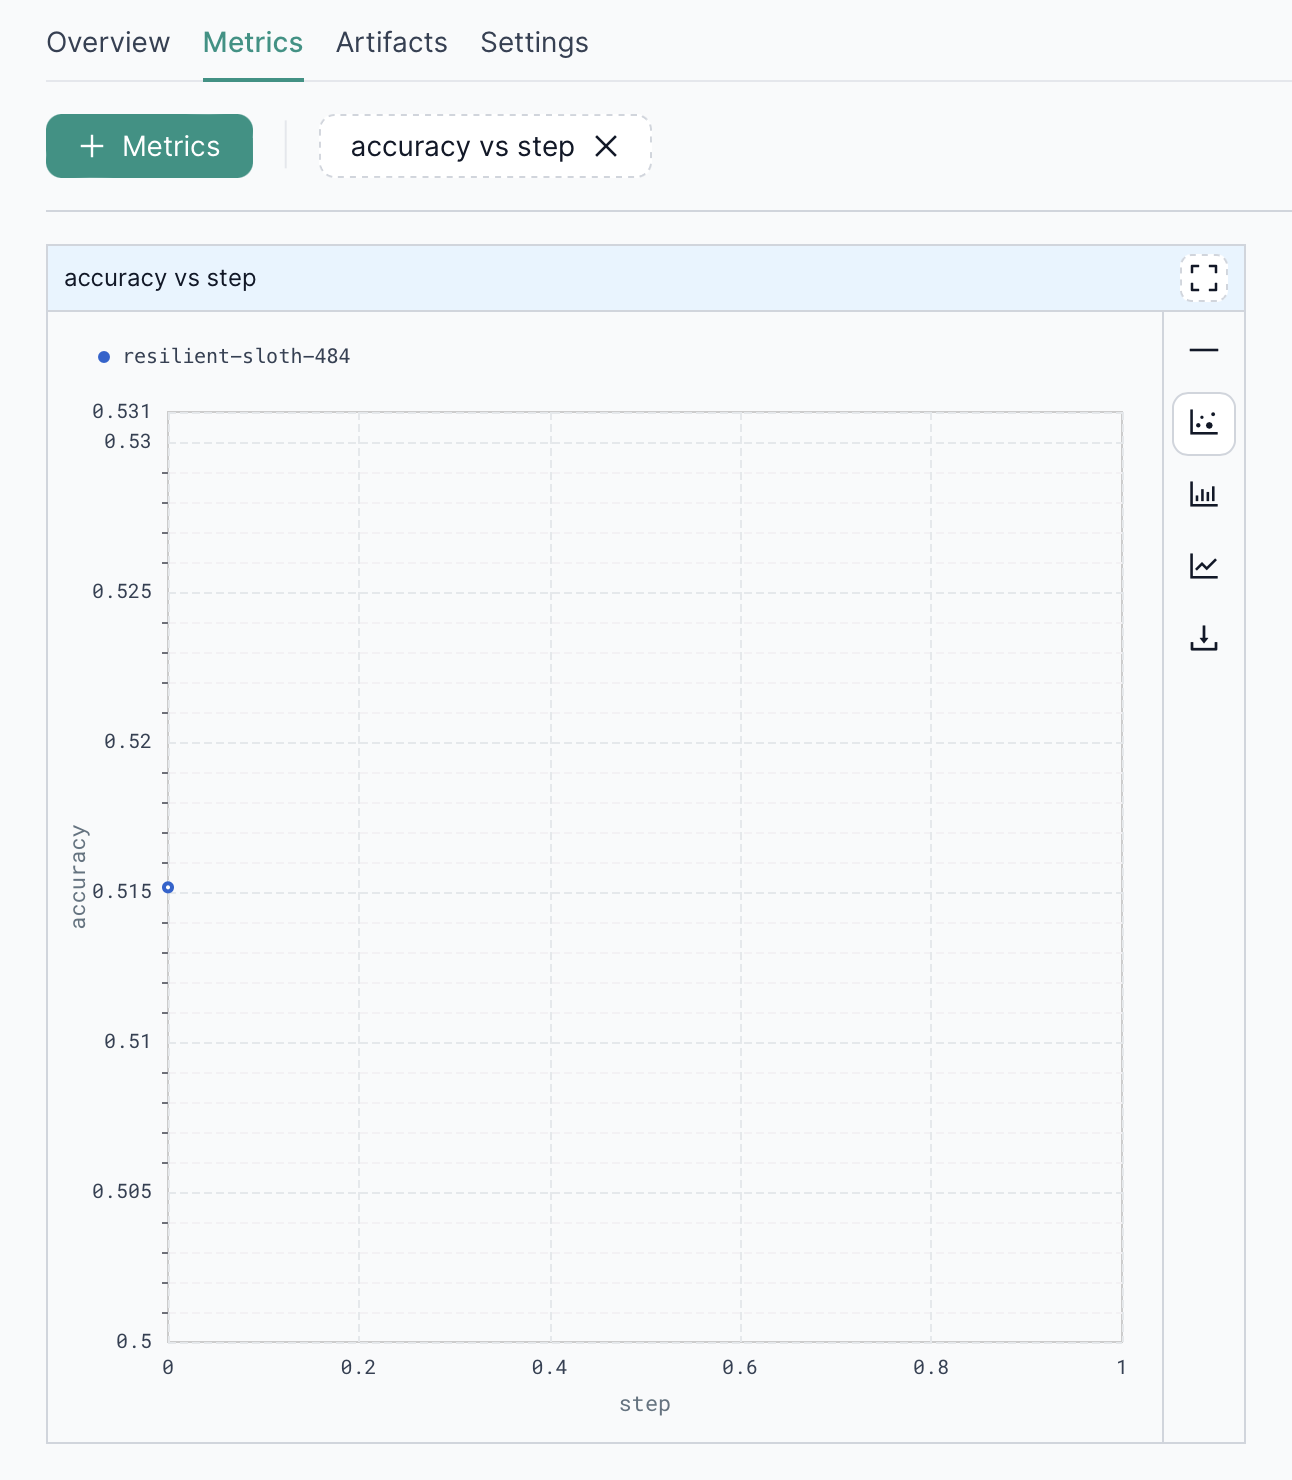
Use the Metrics tab under a run to view all values logged against a metric key.

In this example, the script logs rmse multiple times with a step value. The UI plots those values as rmse against step, so you can see how the metric changes over training iterations.
Metric charts can also be configured. Open the chart settings and change the X-axis from step to time.

After applying the change, the same metric is shown against time.

Use step when you want to compare metric values across training iterations. Use time when you want to inspect when metric values were logged during the run.
System Metrics
System metrics are also available under the Metrics tab. They are sampled every ten seconds while the run is active.

These charts help you understand resource usage during a run, such as CPU utilization, memory usage, disk usage, and network usage.
Compare Runs
On the experiment page, the Compare runs tab lets you compare runs from the same experiment. Now that runs and metrics are clear, the comparison is easier to read: compare runs works against the same metric key and the same step values.
The snippet below shows the pattern: keep related runs in one experiment, then log the same metric key with the same steps for each run.
from oip_tracking_client.v2.tracking import TrackingClient
tc = TrackingClient(
api_host="https://YOUR-OICM-HOST/api/tracking",
api_key="YOUR_API_KEY",
)
# One experiment groups multiple related runs.
tc.set_experiment(
workspace_id="YOUR_WORKSPACE_ID",
experiment_name="diabetes-model-comparison",
)
# Run 1: baseline model
with tc.start_run(run_name="sgd-baseline"):
tc.log_params({
"model": "SGDRegressor",
"epochs": 15,
"learning_rate": 0.01,
})
for step in range(1, 16):
rmse = ...
tc.log_metric("rmse", rmse, step=step)
# Run 2: candidate model
with tc.start_run(run_name="mlp-candidate"):
tc.log_params({
"model": "MLPRegressor",
"epochs": 15,
"hidden_layers": "32-16",
})
for step in range(1, 16):
rmse = ...
tc.log_metric("rmse", rmse, step=step)
This is a short snippet to show the comparison pattern. For runnable code that creates these two runs, see Diabetes Dataset Model Comparison.

The comparison chart shows both runs for the same metric key, rmse, across the same training steps. In this example, the SGD run has a lower RMSE than the MLP run, so SGD performs better for this experiment.
Next Steps
- Experiment Tracking - Learn how runs are grouped under experiments.
- Tracking API Client - Review the supported TrackingClient APIs.
- Tracking Examples - Try simple and multi-run code examples.