Usage Monitoring
Tenant admins can use Usage Monitoring to track resource consumption across multiple dimensions, helping identify trends and optimize utilization within the platform.
1. Overview
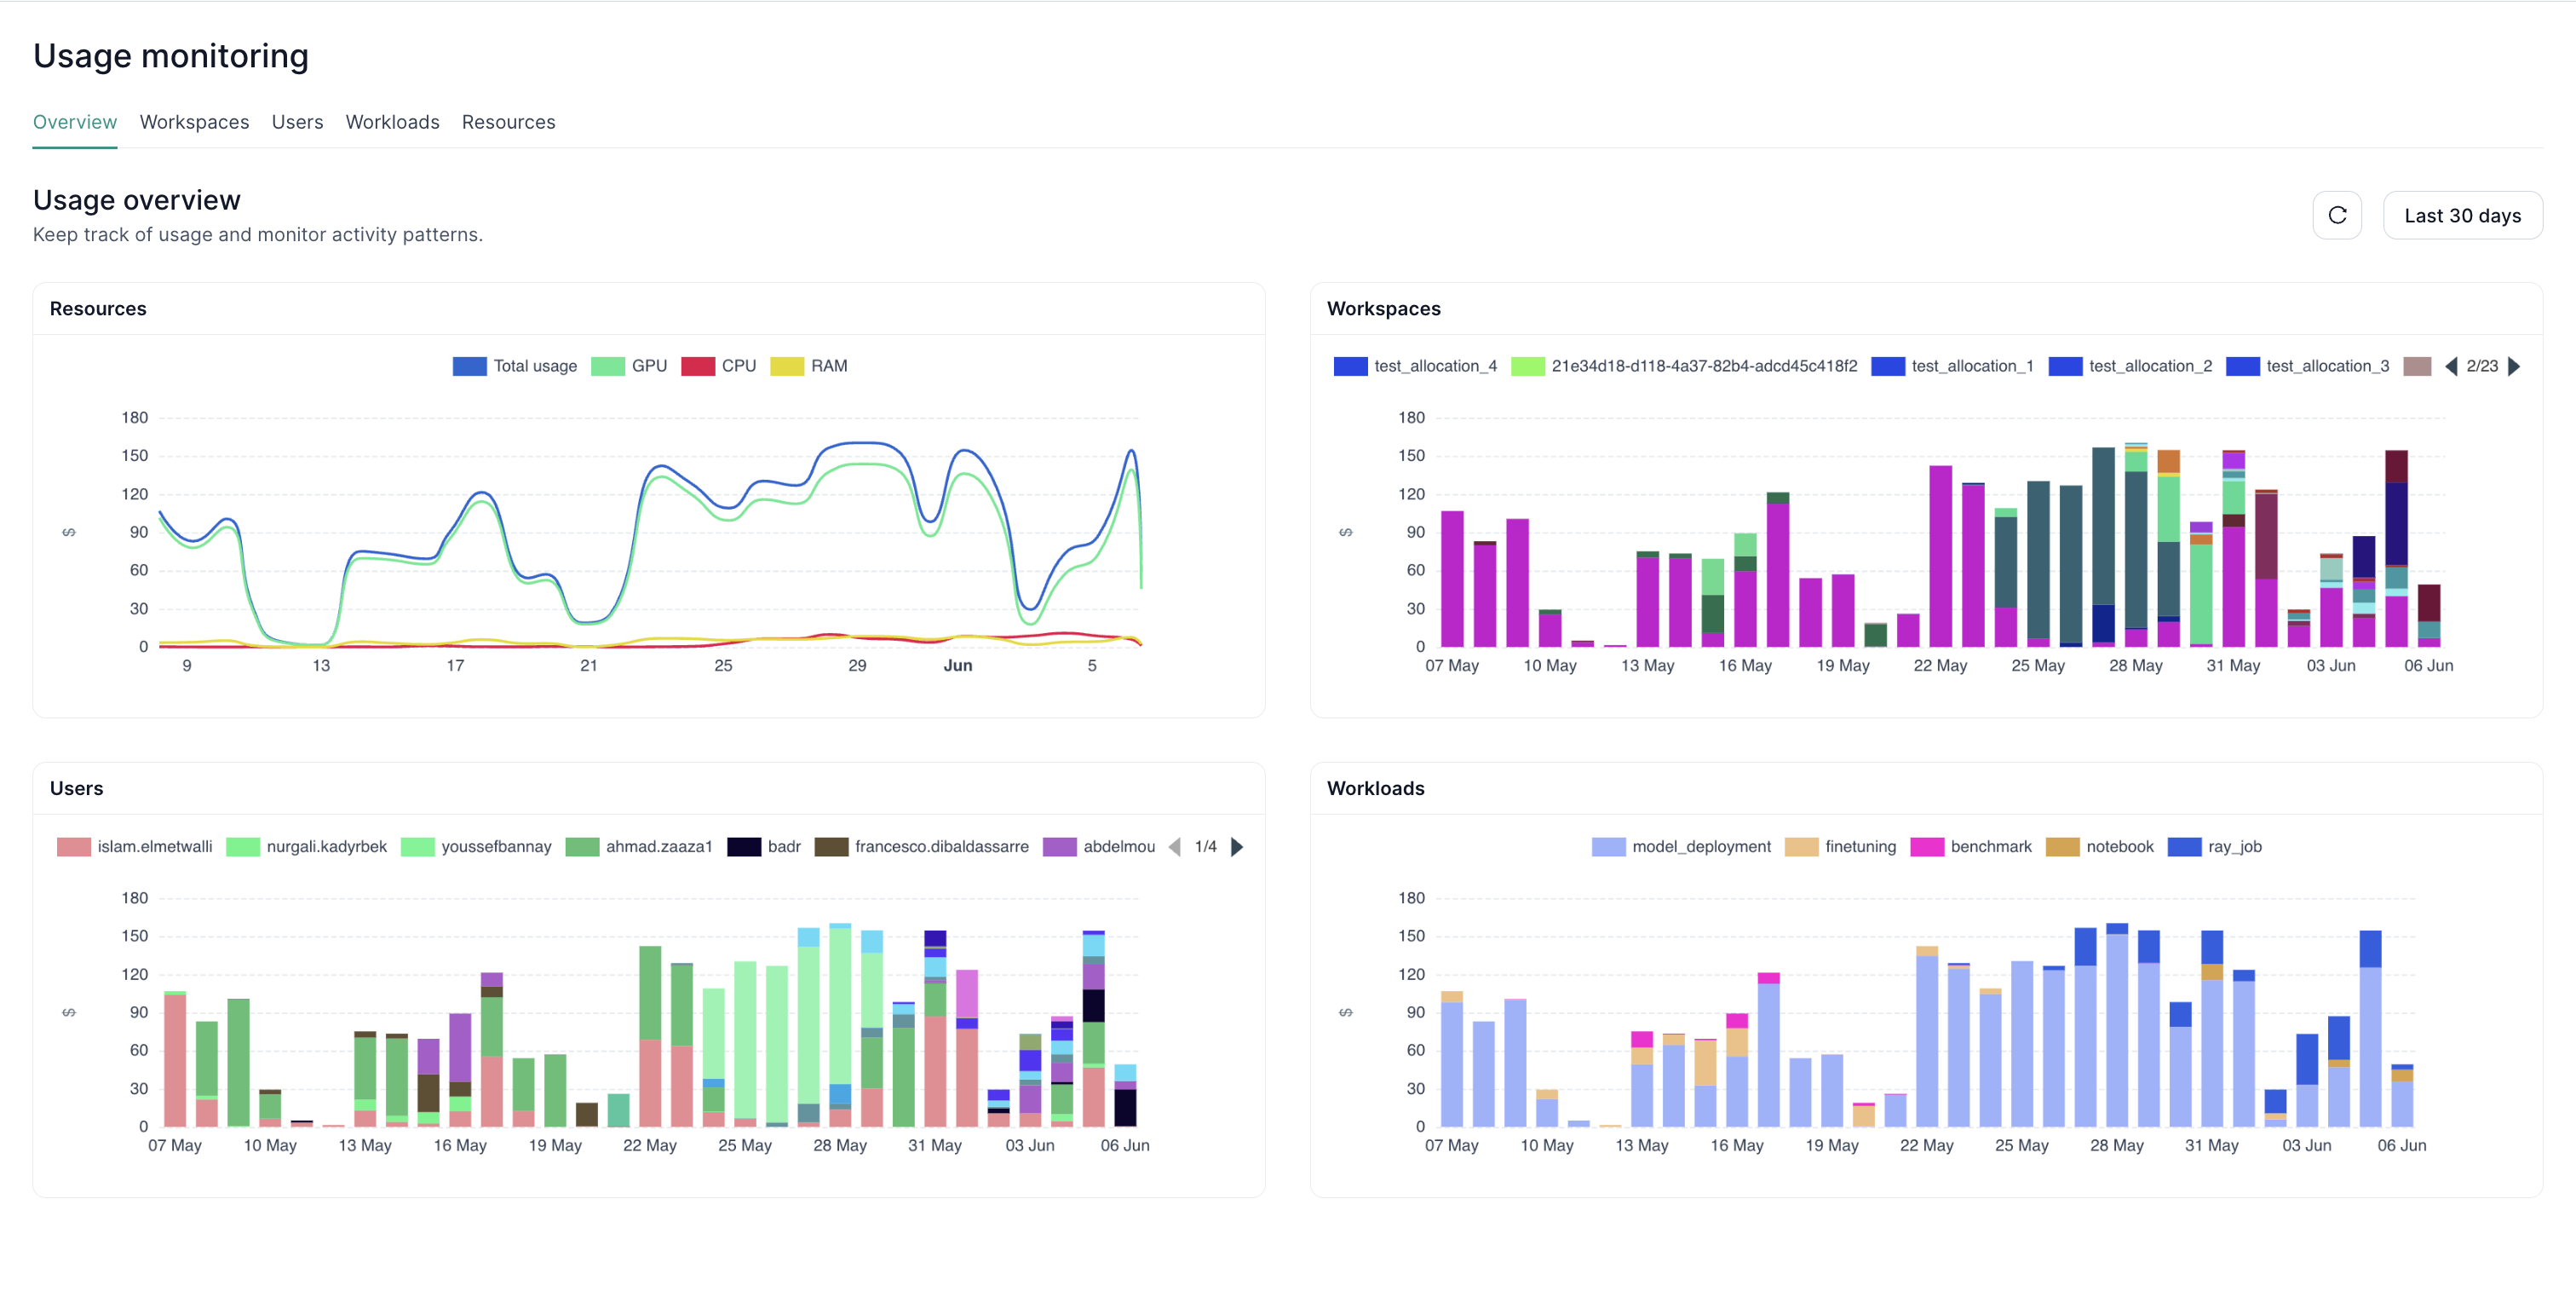
Customize fields (workspace, entity name, timeframe, etc.) to create interactive dashboards. This allows a detailed breakdown of how resources are consumed, segmented by:
- Workspace
- User
- Workload
- Resource
Administrators gain insight into where and how resources are allocated, enabling more efficient governance of the tenant environment.
2. Monitoring by Workspaces
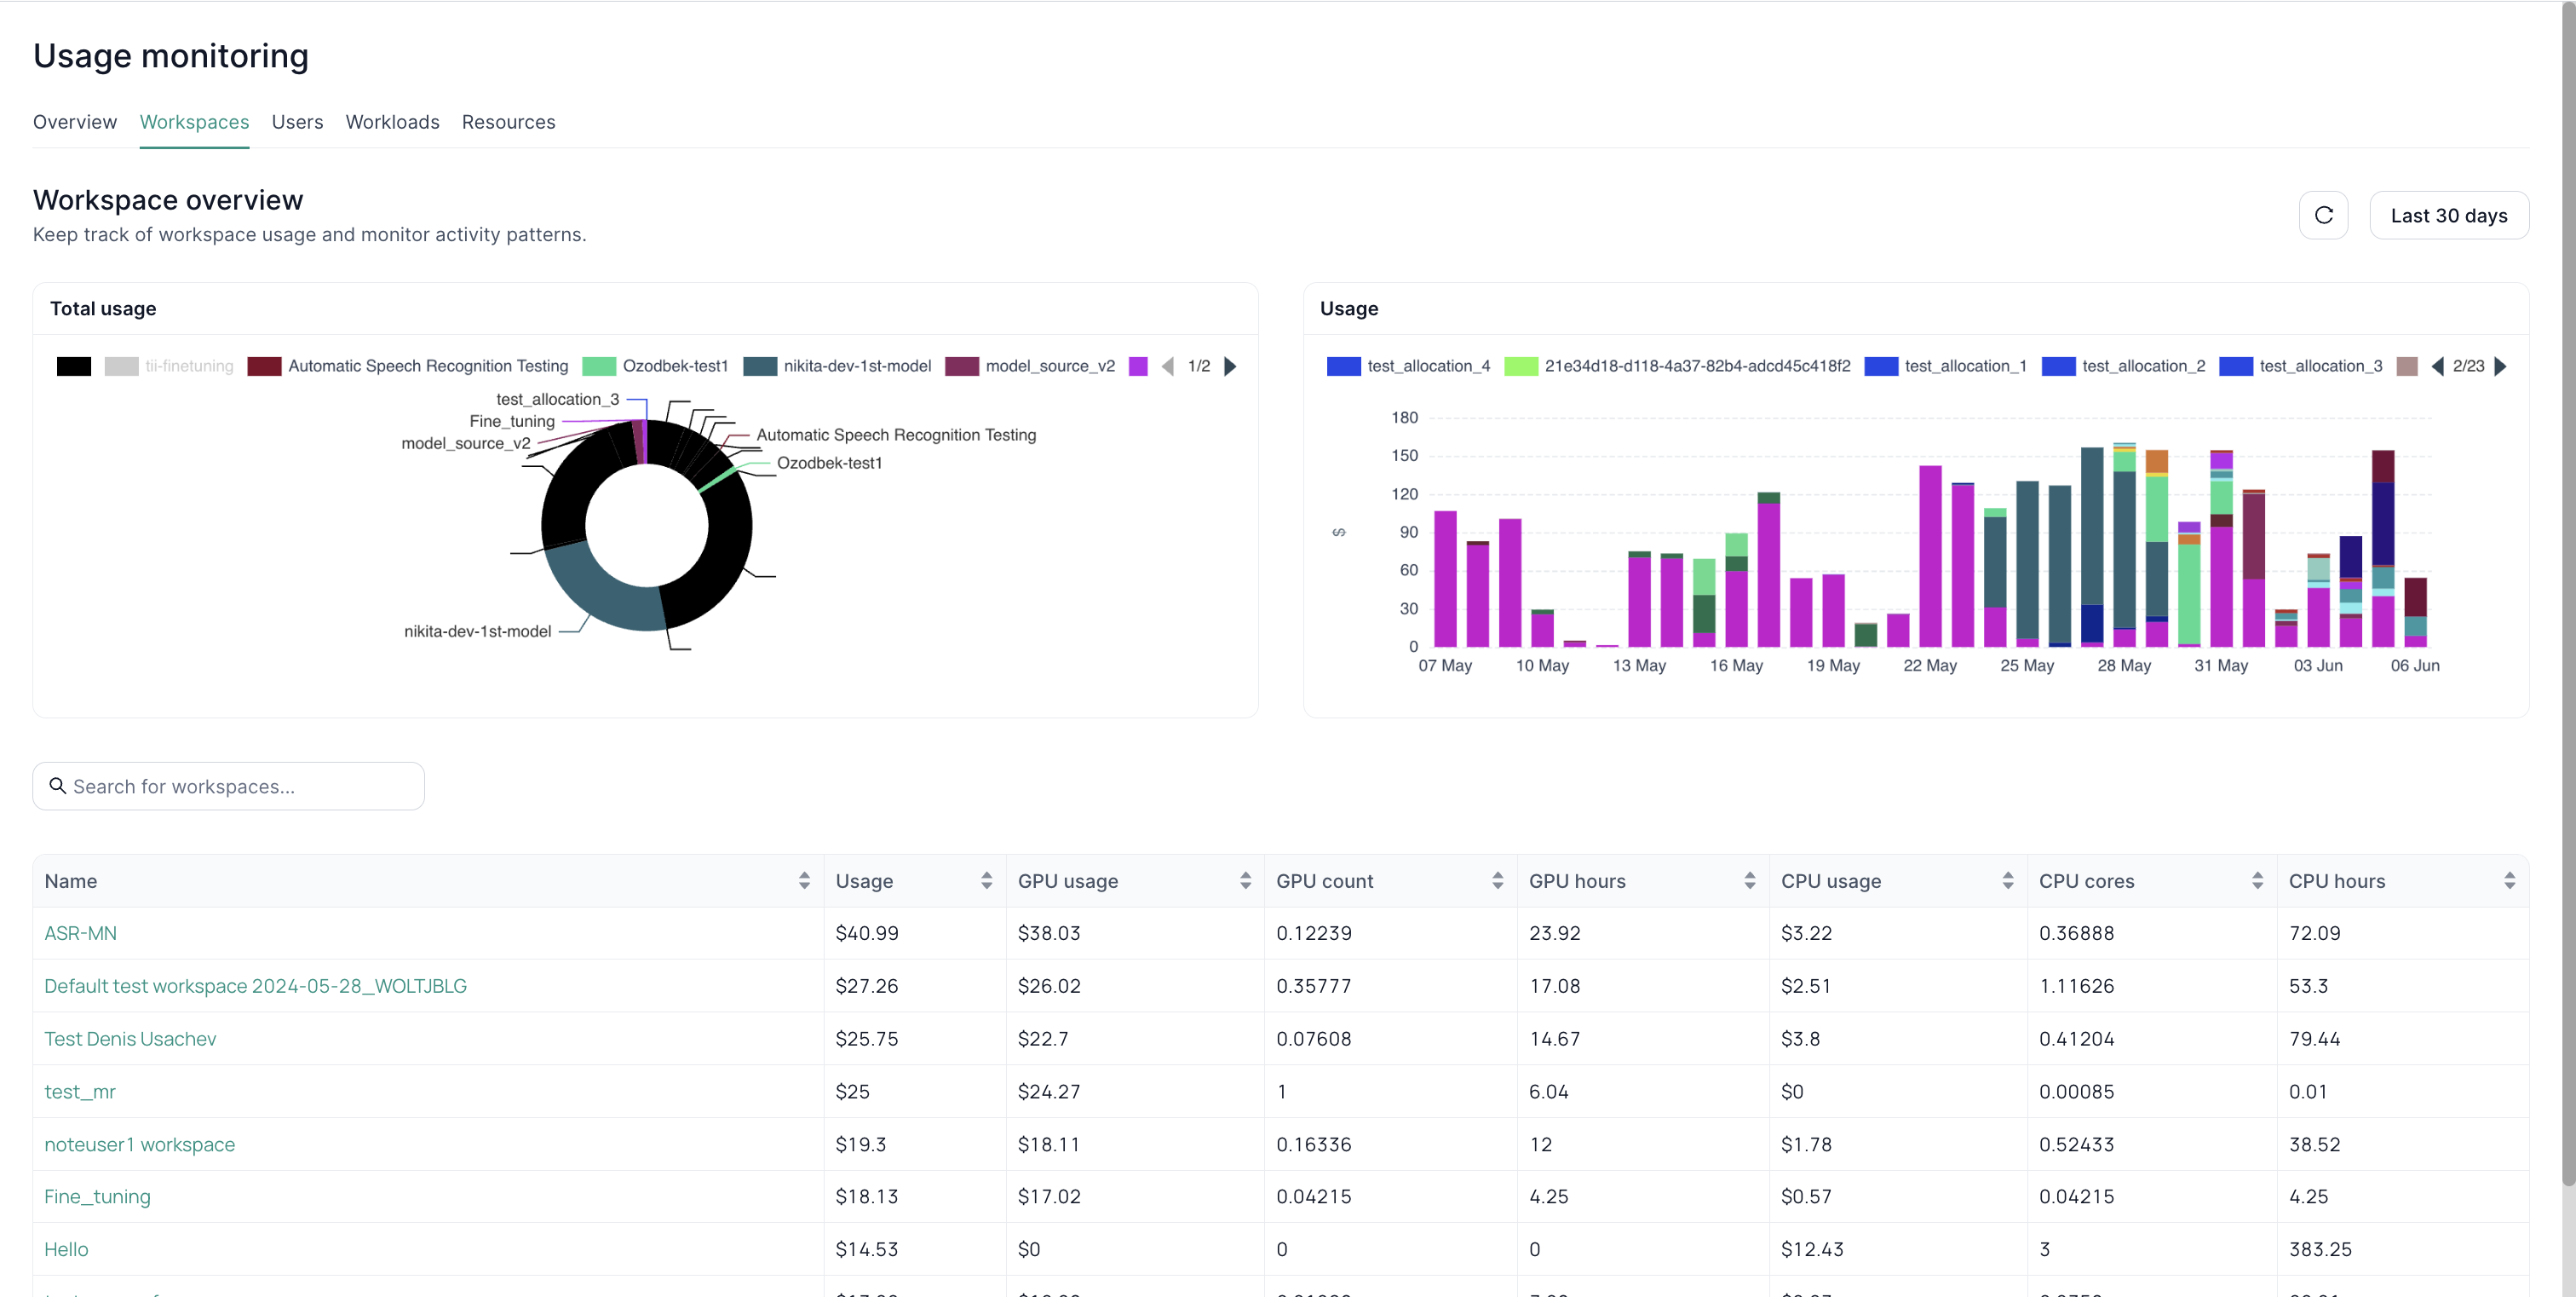
- Pie Chart – Shows the proportion of each workspace’s resource usage.
- Bar Graph – Displays usage trends over the selected timeframe.
Use this to pinpoint which workspace is using the most resources and observe changes over time.
3. Monitoring by Users
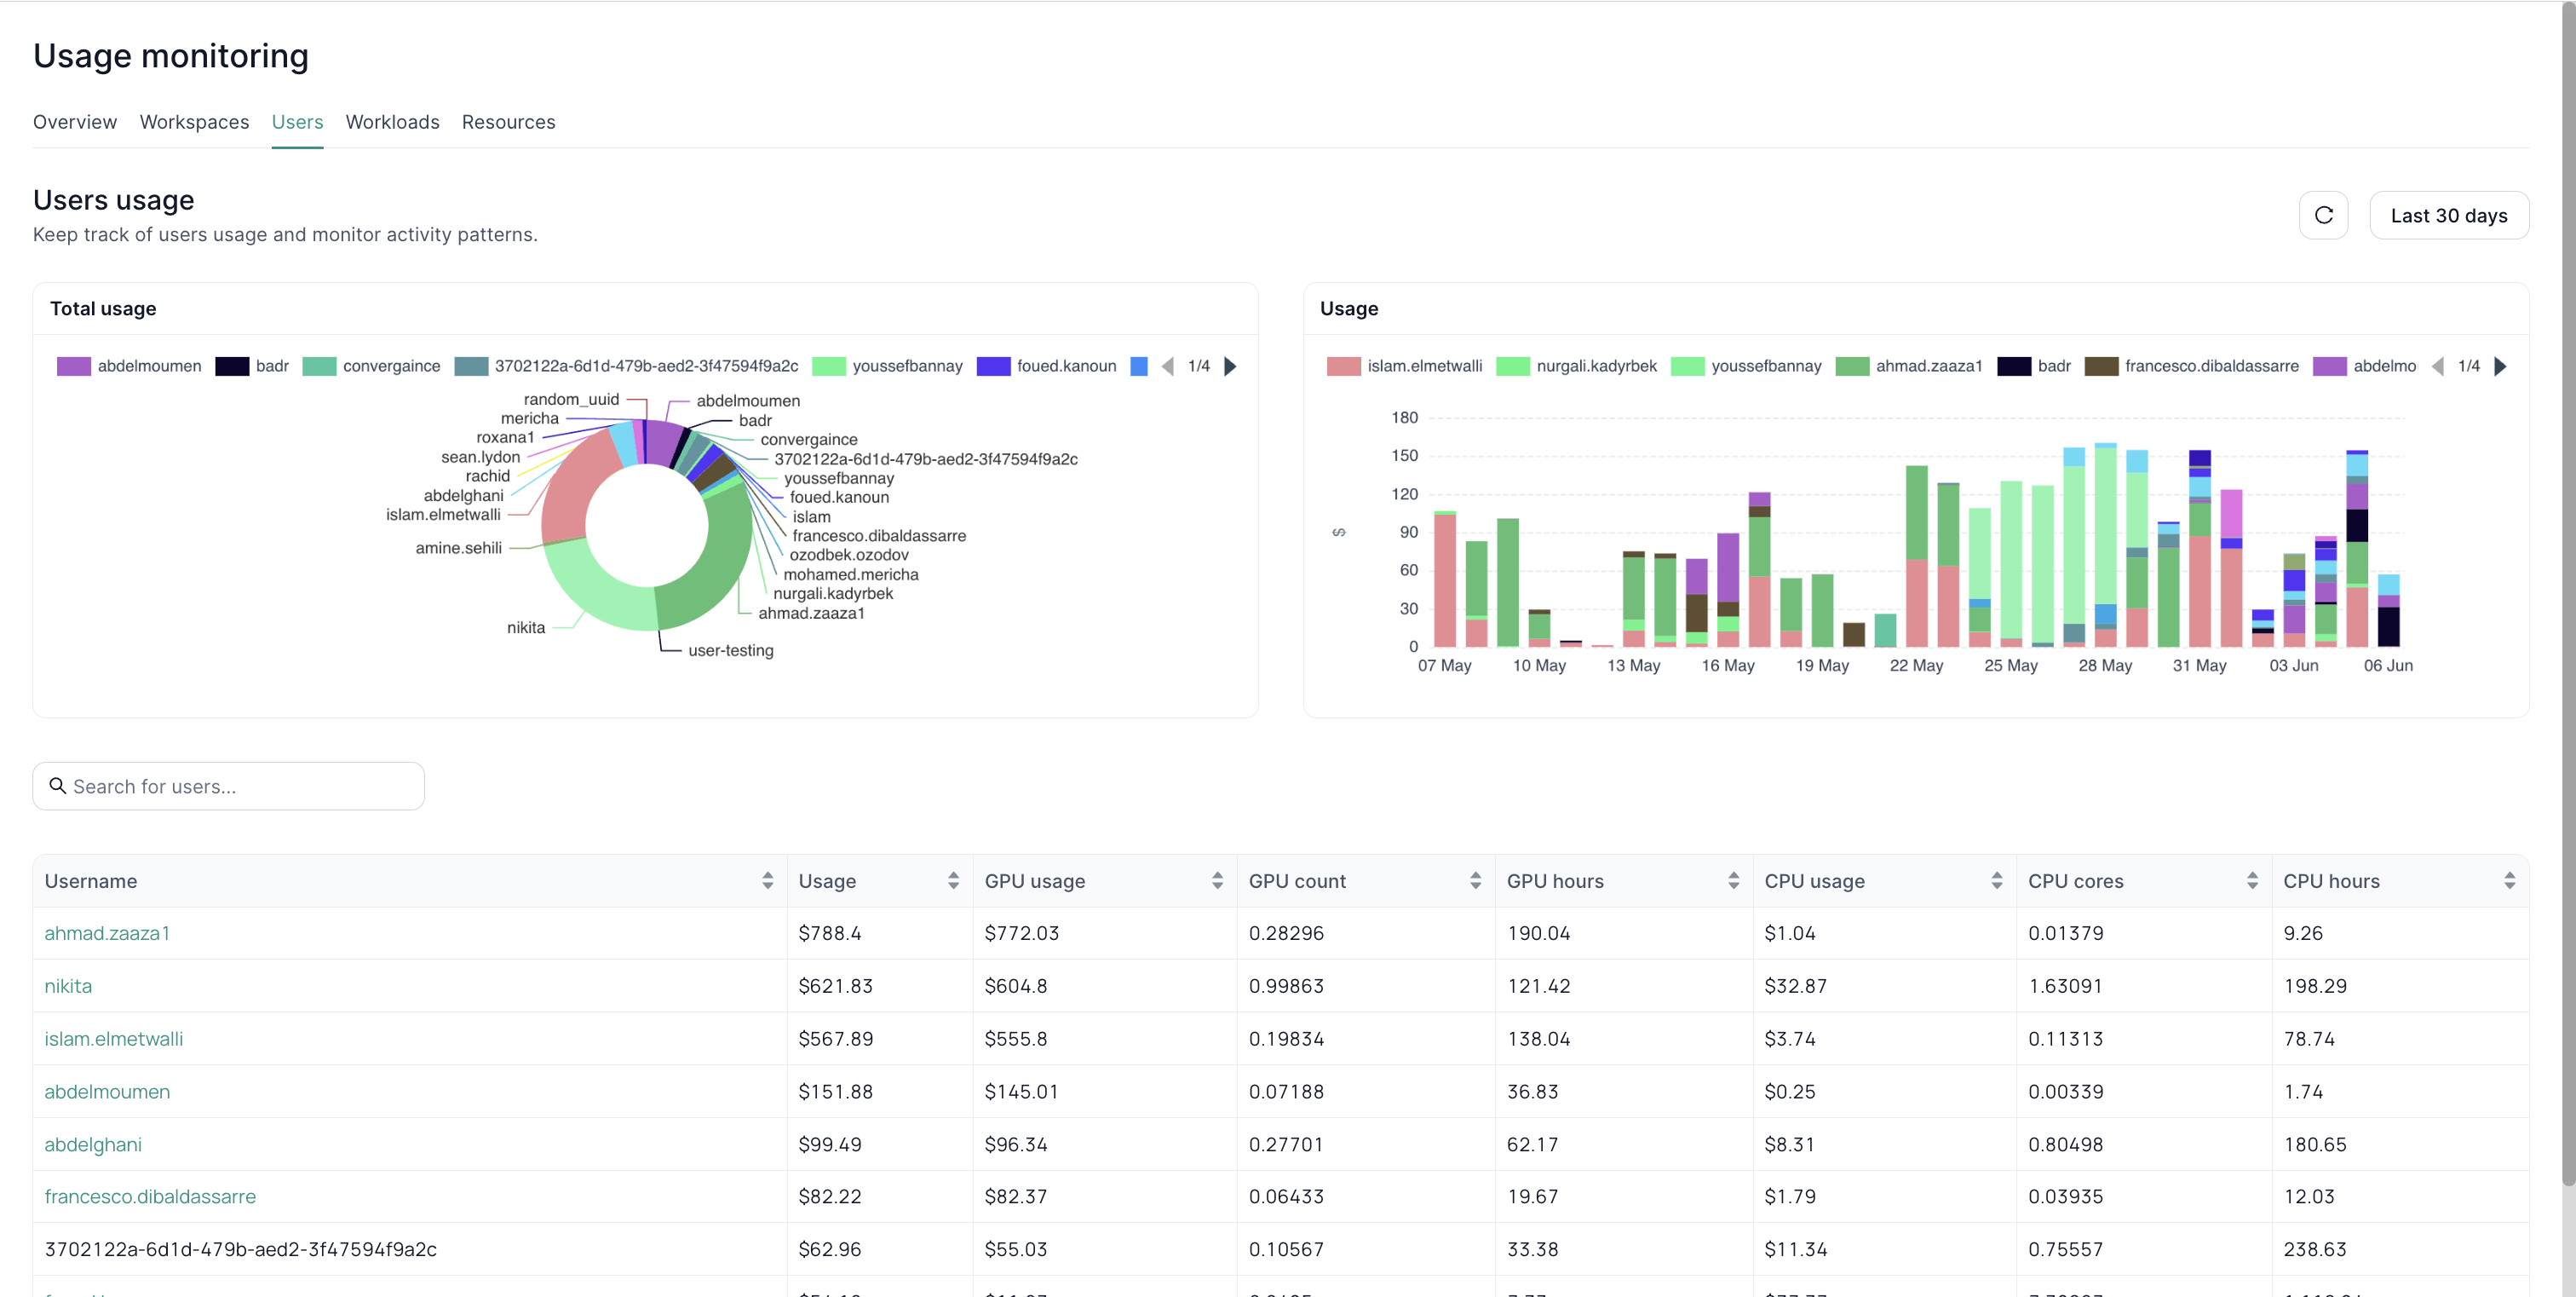
- User-Level Focus – Identify power users or potential over-usage.
- Pie Chart – Illustrates resource consumption distribution among users.
- Bar Graph – Tracks individual user consumption patterns over time.
Ideal for finding optimization opportunities or acknowledging high contributors.
4. Monitoring by Workloads
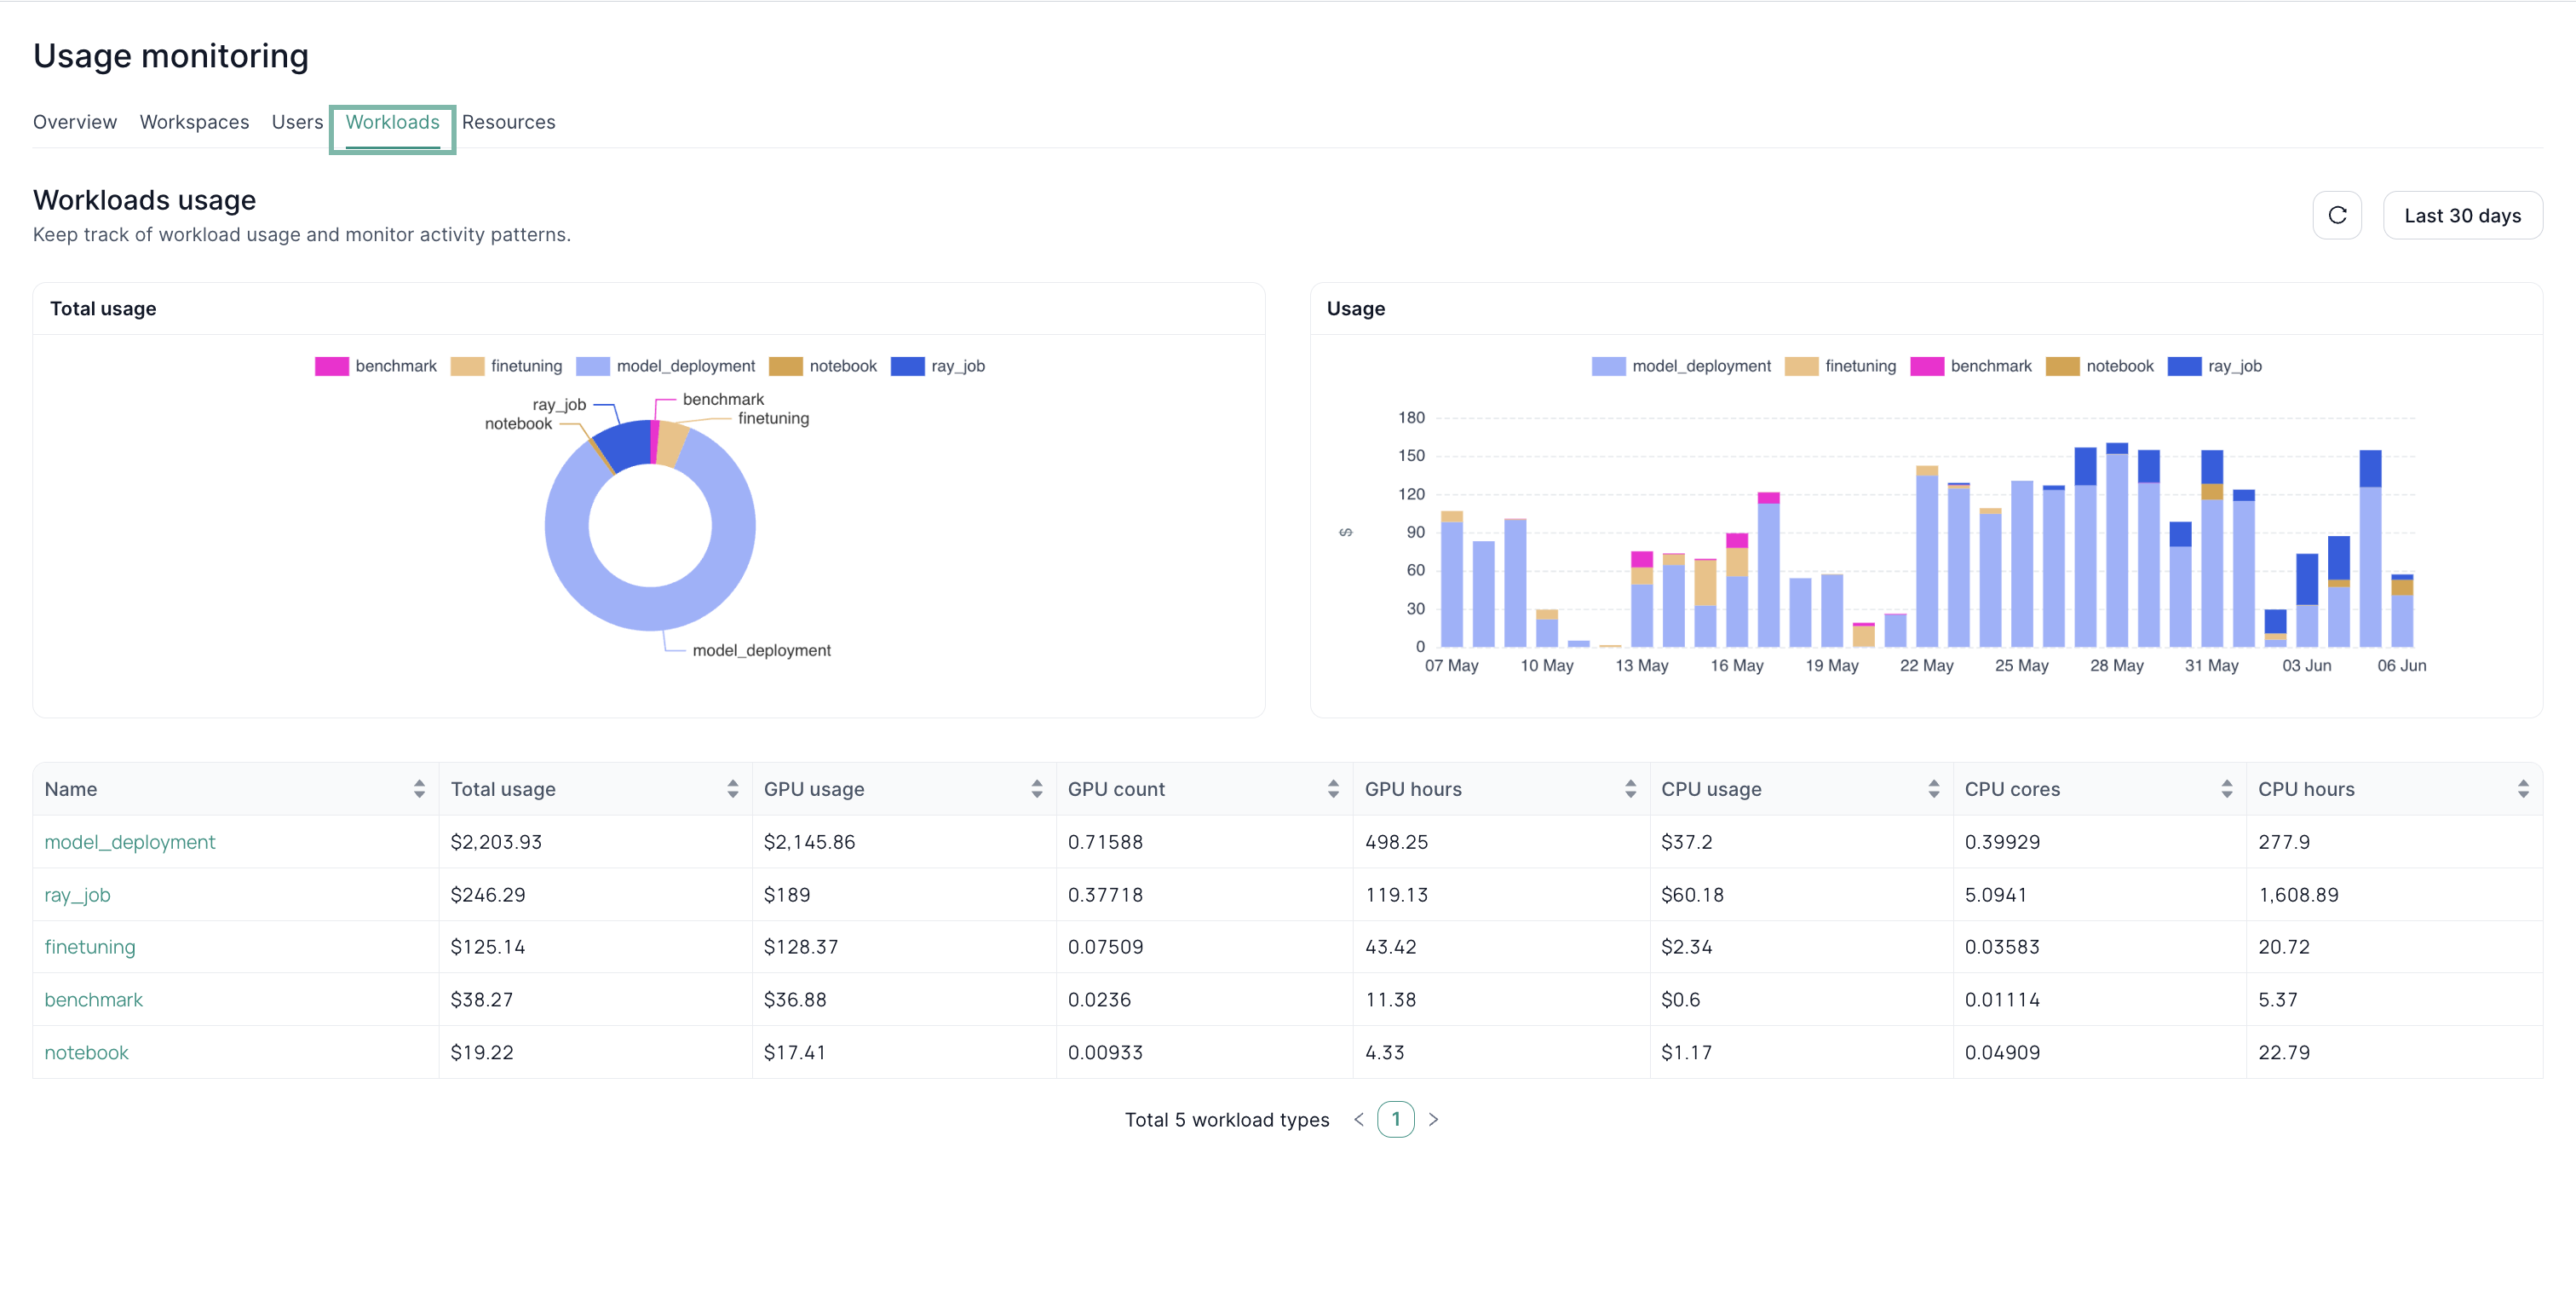
- Workload Types – For example, fine-tuning, deployment, or other tasks.
- Pie Chart – Shows overall resource usage by workload category.
- Bar Graph – Detects shifts in workload usage over time.
- Detailed Table – Provides usage breakdown per workload.
Helpful for analyzing which processes or tasks drive the most consumption.
5. Monitoring by Resources

- Resource Breakdown – CPU, GPU, memory usage patterns.
- Comparison – Compare resource types to see if one is under/overutilized.
- Trends – Visualize changes in usage over time to anticipate scaling needs.
Next Steps
- Admin Tools Overview – Explore other administrative capabilities for tenant-level governance.
- Cluster Monitoring – Track cluster health and performance.
- Resource Allocation – Assign and control CPU/GPU/memory across the tenant efficiently.